The importance of wage pressures in price determination
Historically, we have seen a strong relationship between the unemployment rate and inflation: in general, when unemployment falls, wage pressures tend to increase, and vice versa. However, this relationship, which is known as the Phillips curve, appears to have been weakened in recent years. For example, the reduction in unemployment which has been recorded in the euro area since late 2015 should have generated higher wage growth and, ultimately, inflation. Why has this not happened?
Economic theory leaves no room for doubt: during expansionary phases of the economic cycle, as the unemployment rate decreases, it costs more to hire new workers and to retain existing staff, which usually leads to upward pressures on wages. Broadly speaking, there are two ways in which greater wage pressures result in an increase in inflationary pressures: on the one hand, workers’ higher purchasing power1 leads to an increase in aggregate demand, allowing companies to raise prices. In addition, higher wages increase companies’ production costs and, to the extent possible, this compels them to raise prices to minimise the impact on profits.2
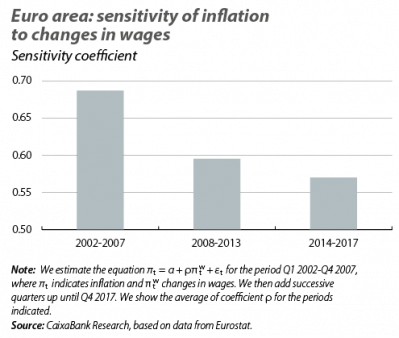
As we pointed out earlier, historically the correlation between wages and core inflation has been very strong. A simple way to illustrate this is to analyse the sensitivity between the two variables, which has remained relatively high for years. However, as can be seen in the first chart, in recent years, inflation’s sensitivity to changes in wages appears to have weakened. Mario Draghi recently pointed out that certain structural elements, such as globalisation and the growth of online shopping, could be behind this tempered inflation.3
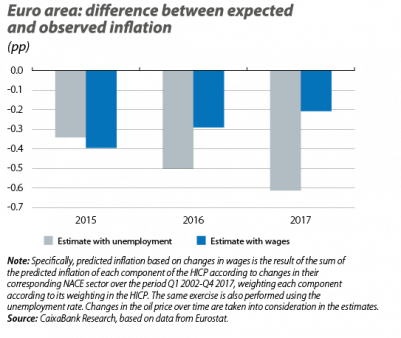
In order to analyse the weakening of the relationship between wages and inflation in greater detail, we have analysed how the various components of the Harmonised Index of Consumer Prices (HICP) for the euro area have changed over time, as well as salaries in each of their sectors. Specifically, we have estimated the changes we would expect to see in each component of the HICP, based on changes in wages in each sector, if the historical relationship between the two variables were maintained. As the second chart shows, in the last few years, core inflation has consistently been below expectations. Nevertheless, it is important to note that this difference has been reducing over time.
If, on the other hand, we perform the same exercise but analysing the relationship between unemployment and inflation, the result is even more surprising. Not only has inflation been lower than expected (given the changes in the unemployment rate), but this shortfall has also increased over time.
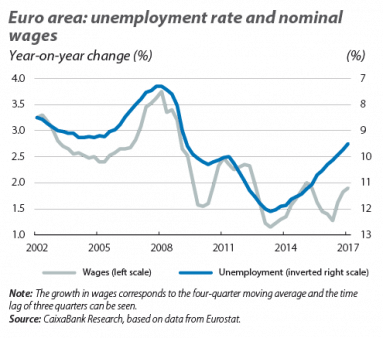
To complete our understanding of the relationship between these three variables, in the third chart we show how the correlation which has historically existed between wages and unemployment appears to have broken down in recent years.
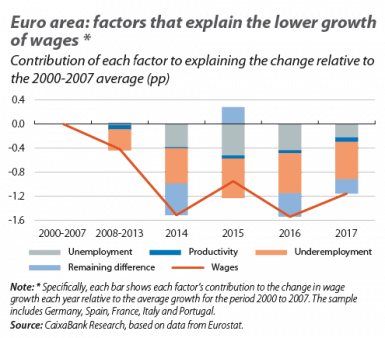
There are several factors which might explain the moderate growth in labour costs despite the fall in unemployment, but one of the most significant factors seems to be the increase in underemployment, since this means that the labour market is less saturated than the unemployment rate would suggest.4 In particular, the percentage of underemployed workers steadily increased from 2002 until it reached an all-time high in 2015, when it stood slightly above 6%. Since then, it has shown a moderate decline, but still remains relatively high (5.7% in 2017). The second factor which might explain the lower growth in wages is productivity, which has grown at a much lower rate in recent years.5
When we use statistical techniques to assess the weighting of these two factors in explaining the lower growth in wages, we note that underemployment is the major driver.6 As shown in the last chart, the conventional measure of saturation in the labour market, namely the unemployment rate, explains much of the restraint in wages witnessed in recent years. However, the impact of the high rate of underemployment is even greater. As for the growth in productivity, the analysis suggests that this has had a minor role recently.
Finally, it is important to note that the ability to explain wage growth with the variables discussed above has reduced in recent years. This suggests that other factors are likely to be playing an increasingly important role in determining how wages change over time. Among these factors, the main candidates appear to include an increase in temporary contracts and, in some countries, higher immigration, although there is currently no empirical evidence to corroborate this.
In short, it appears that the weak increase in both inflation and wages in recent years is largely due to the fact that the euro area remains in the early stages of the expansionary cycle. This is particularly the case since the labour market is still relatively unsaturated (and less than the unemployment rate would suggest). Therefore, the euro area still has a lot of room to continue growing without generating inflationary pressures. That said, as the labour market becomes more saturated, we should see wage growth and, ultimately, inflation begining to pick up.
1. To the extent that inflation takes a few quarters to pick up, the rise in workers’ wages translates into an increase in their purchasing power.
2. See A. Nevo and A. Wong (2018), «Measuring inflation in the modern economy - a micro price-setting view», ECB Forum on Central Banking.
3. See the speech by M. Draghi in Sintra in June 2018 at www.ecb.int
4. Specifically, underemployment takes into account part-time workers who want to work more hours. For more information, see the Focus «Beyond the unemployment rate» in MR12/2017.
5. The average growth of real productivity for the periods 2000-2007, 2008-2013 and 2014-2017 was 0.9%, 0.5% and 0.5%, respectively, for the main economies of the euro area.
6. Following the methodology used by the IMF (2017), we estimate the following equation: πwi,t = α + ρπwi,t–1 + βui,t + Υprodi,t + δsubi,t + φidi + εt where πw denotes the growth in wages, u the unemployment rate, prod the three-year moving average of the growth in labour productivity, sub the underemployment rate, d a country indicator and ε what remains of the difference. i denotes the country and t the period. The sample includes annual data between 2000 and 2017 and the countries included in the analysis are Germany, France, Italy, Spain and Portugal.


