Tracking core inflation: the pricing chain
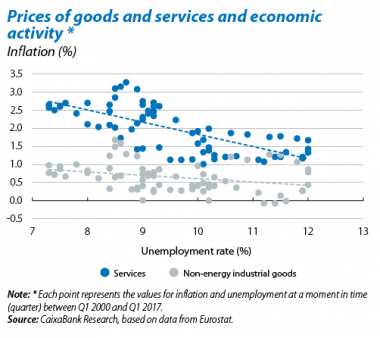
The prices of energy and unprocessed food have been volatile recently. The ECB has therefore turned its attention to the trend in core inflation, which excludes these components, in order to analyse the underlying price dynamics. Previous Focus articles1 have examined how the trend in core inflation is related to developments in the labour market. One reason is that the main component of core inflation, services with 54% of the basket, is particularly labour-intensive. Another important component receives less attention, however: non-energy industrial goods (NEIG), with a 32% share of the basket.2 As can be seen in the first chart, NEIG inflation is much less tied to the cyclical position of the economy. So what are its main determinants and outlook?
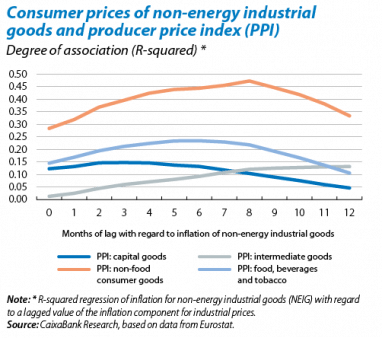
NEIG are manufactured goods3 and their prices are formed throughout production chains involving commodities, production factors, imports and intermediate goods, giving rise to indicators for producer prices.4 The second chart shows the link between NEIG prices and the main indicators of producer prices. Two of these indicators are particularly informative: the prices of intermediate goods, indicative of early stages in the chain, and non-food consumer goods for the later stages. As can be seen, NEIG prices are especially associated with the producer price of non-food consumer goods. Changes in producer prices also take some time to achieve their maximum impact on NEIG prices: the lag is eight months for non-food consumer goods. If we go back one step in the production chain, there is also a strong link between the prices of intermediate goods and non-food consumer goods, reaching maximum impact with a lag of around seven months.
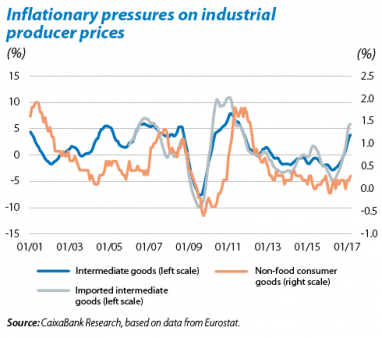
As can be seen in the third chart, since the end of 2016 inflation for intermediate goods has recovered notably, coming particularly from imported intermediate goods. This reflects the recovery in global producer prices, affected at least in part by commodities. Such relationships suggest that NEIG inflation will recover over the coming months.
As higher producer prices are passed on down the chain or «pipeline», this will help core inflation to recover, in addition to the effect of the improved labour market. As we have seen in this and previous Focus articles, both processes point to a gradual upturn in core inflation, a situation that will influence the ECB’s next few meetings.
1. See «Core inflation scenarios: activity, periphery and oil», in MR12/2016.
2. The remaining 14% corresponds to processed food.
3. The NEIG basket contains a range of goods, such as pharmaceutical and personal care products, cars, computers, clothing and footwear.
4. The difference between producer and consumer prices corresponds to distribution and retail margins.


