Do tariffs work as a fiscal revenue tool in the US?
It is difficult to curb imports in order to defend local production while relying on them as a source of tax revenues. In fact, the more successful US trade policy is in restricting imports, the lower the revenues that can be expected.


The use of tariffs has become a centrepiece of the Trump administration’s economic policy. With this strategy, the White House has declared that it is pursuing three main goals: protecting domestic industries and repatriating manufacturing to US soil (including bolstering economic independence in strategic sectors), correcting the trade deficit, and boosting revenues to fund part of the growing fiscal deficit. However, these objectives are difficult to reconcile with one another. It is difficult to curb imports in order to defend local production while relying on them as a source of tax revenues. In fact, the more successful trade policy is in restricting imports, the lower the revenues that can be expected. This underlying tension raises doubts about the power of tariffs as a revenue source, and it is precisely on this point that we focus the analysis of this article.
Effective tariff: from 2% to 15%... to what level?
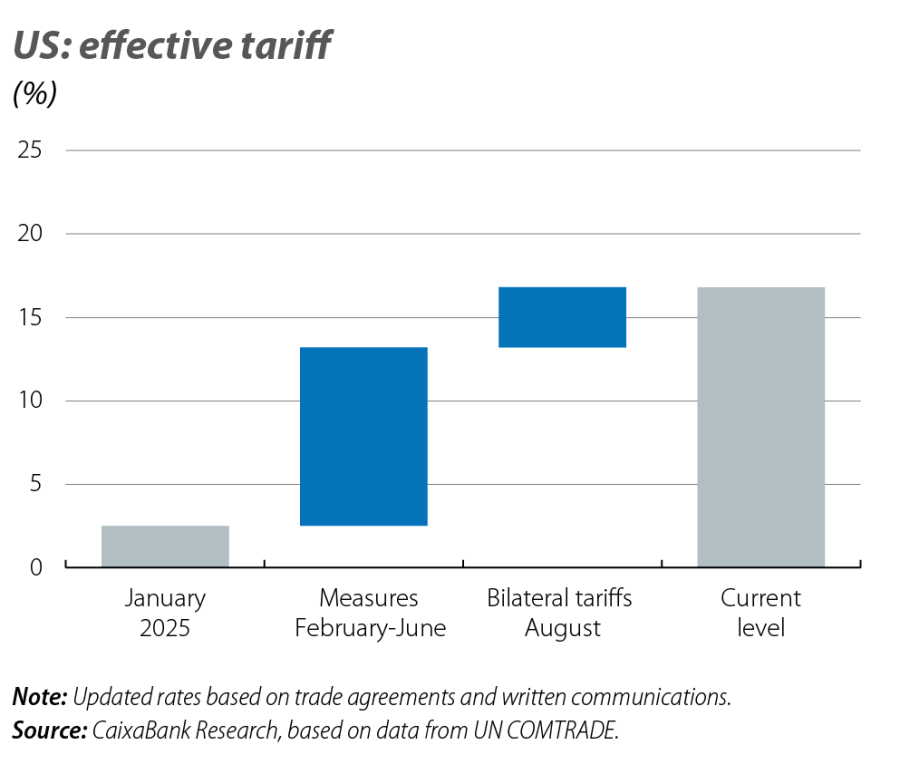
As of August 2025, we estimate that the average effective tariff applied by the US stands at around 17%. This represents an increase of 2 pps compared to our June estimate1 and one of 15 points since the beginning of the year. This level reflects the accumulation of measures introduced between February and June: the universal tariff of 10%, 50% on steel and aluminium, 25% on cars, as well as 35% on Canada, 25% on Mexico2 and 45% on China. It also incorporates adjustments resulting from bilateral agreements reached in the summer with partners such as the United Kingdom (10%), the EU (15%) and Japan (15%), where cars are taxed according to the country-specific tariffs in place. It also includes the new, higher tariffs affecting countries such as Switzerland (39%), India (50%) and Brazil (50%). It should be noted that some negotiations remain ongoing: China (deadline on 10 November), Mexico (deadline at the end of October), the EU (pending, inter alia, the list of strategic products subject to 0%) and possible sector-specific tariffs on electronic and pharmaceutical products, so the final level is yet to be known.
- 1
See the Focus: US tariffs: where do we stand and what comes next? in the MR06/2025.
- 2
The tariff imposed on Mexico and Canada only applies to goods that do not meet the conditions of the USMCA.
Revenues from tariffs: from 0.3% of GDP... to 1%?
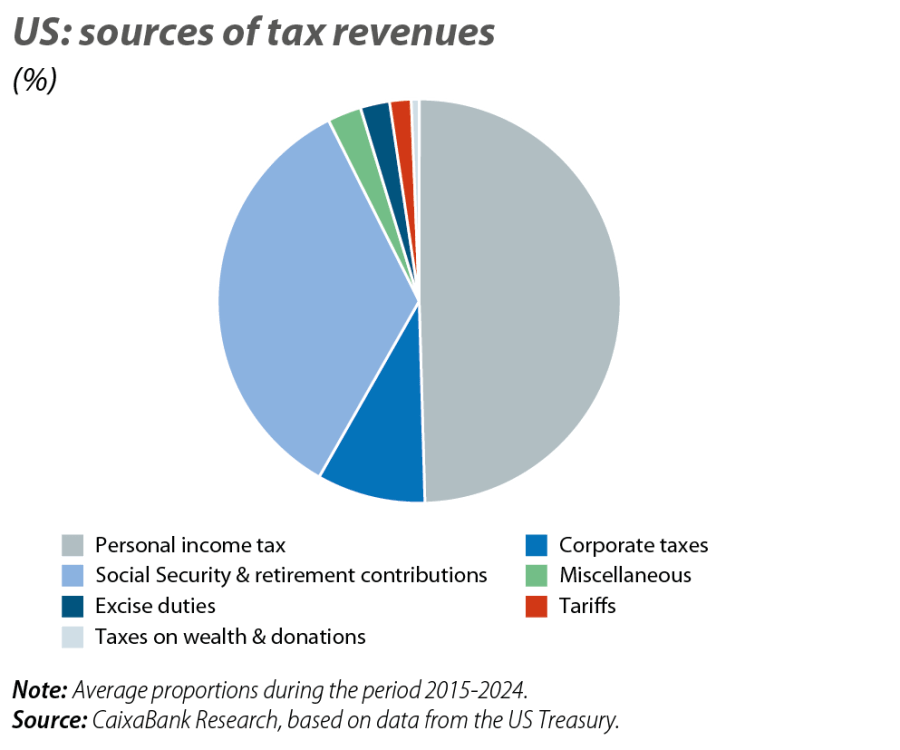
Historically, US Treasury revenues from tariffs have been marginal, since up until recently they had not been intended as an important fiscal policy instrument or tax collection mechanism. The main sources of income have traditionally been corporate and personal income taxes, which together have accounted for some 60% of total revenues, equivalent to around 10% of GDP. By comparison, tariffs have contributed just 2% of total tax collections and 0.3% of GDP.3
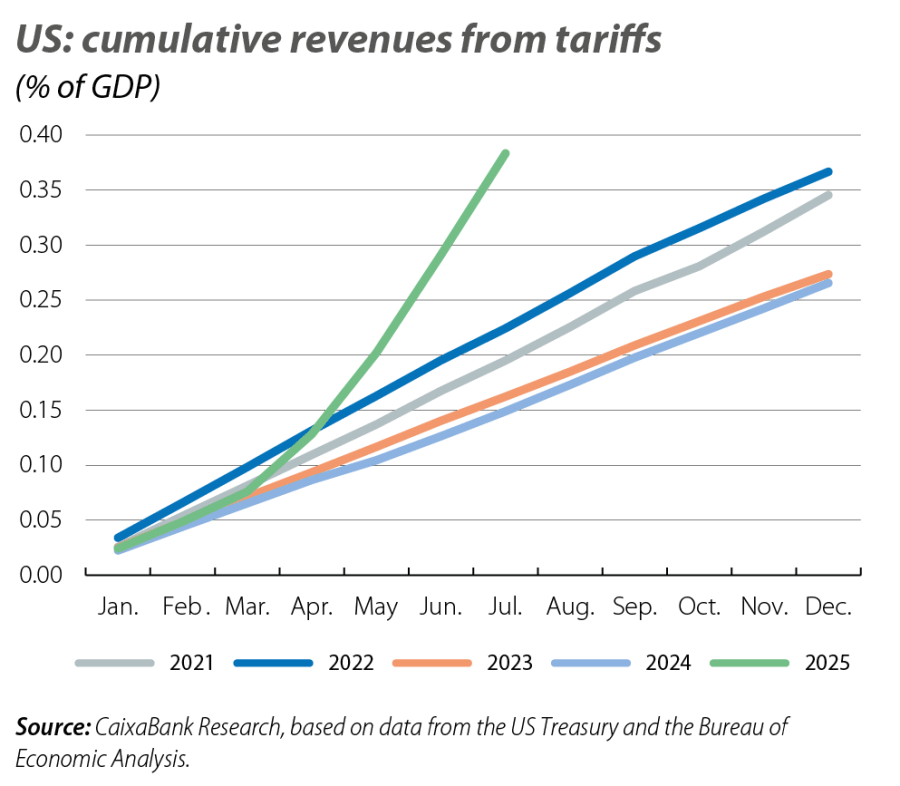
However, this year the pattern has begun to change, especially since April, following the entry into force of the universal tariff of 10%, along with other sector-specific ones. Between January and July alone, the Treasury has raised 114.9 billion dollars in tariffs, equivalent to nearly 0.4% of GDP. In other words, so far this year, more revenue has been collected through this means (as a proportion of GDP) than in all of 2023 and 2024 combined (see second chart). Beyond the first half of the year, the final result will henceforth depend on both the final level at which the tariffs settle and the behaviour of imports.
- 3
If we exclude revenues from Social Security contributions, income from corporate and personal income taxes represent 89% of the total and tariffs, 3%.
In this regard, data for the first half of the year reveal that, after having surged by almost 20% quarter-on-quarter in Q1 in anticipation of the tariffs, imports of goods fell 20% month-on-month in April before stabilising between May and June at around 270 billion dollars, just below the prior year average (274 billion dollars). In a scenario in which we assume that monthly imports will stabilise at around these levels, and we apply an effective tariff of 17% (the level in place right now), the total revenues for the year from this source would amount to 1.1% of GDP.
Is 1% a realistic and sustainable long-term scenario?
For the White House, it is crucial to keep revenues from tariffs at high levels in order to cover part of the projected increase in the public deficit over the next 10 years as a result of the new budget act. Collecting revenues equivalent to 1% of GDP, as we projected earlier, would prevent a significant deterioration in the fiscal accounts. Is this level actually achievable?
The success of this strategy depends not only on the level of the tariffs, but also on whether imports remain stable. For that to happen, at least two conditions are needed: that the elasticity of imports to prices be low and/or that aggregate demand remain strong.
Let’s start with the first condition. The behaviour of imports will depend, first of all, on how tariffs are passed on to prices, that is, how the cost is shared between exporters, importers and final consumers. Several studies on the tariffs imposed on China in 2018 found that they resulted in an almost one-for-one increase in the price of imported goods, suggesting that it was US importers and consumers who absorbed the cost.4
Surveys conducted by various regional Fed banks show that many firms plan to pass the tariffs on to consumers either fully or in part. For instance, a survey by the Atlanta Fed5 reveals that at least 55% of firms plan to do so, and of that group, half plan to pass on «all» or «most» of the cost. Although it is still early to assess the final impact on consumer prices, CPI data from June and July showed that prices of certain imported goods have already begun to rise.6 If part of the tariffs is passed on to the final consumer, then the behaviour of imports going forward will depend on the sensitivity of demand to prices. The price elasticity of imports has been estimated by several studies to lie somewhere between –1 and –57 Taking the most conservative value (–1),8 we can assume that a 1% increase in the price of an imported good reduces its demand by 1%.
One channel that could partially cushion this effect is the exchange rate. A strong dollar would help counteract an increase in the price of imported goods. However, so far this year, the dollar has depreciated by 10% against its main peers, possibly weakened by growing expectations of an economic slowdown in the US.
This last point leads us to the second condition needed for tariff policy to work as a sustained revenue mechanism: that aggregate demand is not weakened. Our forecasts point to a moderation in GDP growth, from 2.8% in 2024 to 1.3% in 2025 and 2026 (the analyst consensus places it around 1.5%). This anticipated cooling is explained both by the direct effects of the tariffs – through the mechanisms described – and by the increased uncertainty, which will adversely affect consumption and investment decisions. In addition, a foreseeable cooling in the global economy will weigh down foreign demand for US exports, and in a less dynamic environment, imports will inevitably be affected.
So far, a sharp fall in imports has not materialised, but that is because an anticipation effect still persists. In addition, we should recall that some goods, such as pharmaceuticals and semiconductors, have remained exempt from tariffs up until now, and this maintains the incentive to accumulate stocks. For example, according to US Census Bureau data, imports of pharmaceutical products have increased so far this year by 15%, while imports of furniture and clothing have fallen by 15% and 10%, respectively.
In short, the increase in tariff revenues has been significant and reaching 1% of GDP would be a material figure, but it seems difficult to do so in a sustained manner over time.
- 4
See M. Amiti, S.J. Redding and D.E. Weinstein (2019). «The impact of the 2018 tariffs on prices and welfare». Journal of Economic Perspectives, 33(4), 187-210. And A. Cavallo, G. Gopinath, B. Neiman and J. Tang (2021). «Tariff Pass Through at the Border and at the Store: Evidence from US Trade Policy». American Economic Review: Insights, 3(1), 19-34.
- 5
Federal Reserve Bank of Dallas (2025). «Texas Business Outlook Survey: Special Questions». April.
- 6
See the CaixaBank Research Brief Note on US inflation published in June (content available in Spanish).
- 7
See R.C. Feenstra, P. Luck, M. Obstfeld and K.N. Russ (2018). «In Search of the Armington elasticity». The Review of Economics and Statistics, 100(1), 135-150.
- 8
O. Jeanne and J. Son (2020). «To What Extent Are Tariffs Offset by Exchange Rates?» Working Paper nº 27654, National Bureau of Economic Research.