What do we mean when we talk about uncertainty?
Generally speaking, when we use the word uncertainty we are referring to a lack of knowledge about a particular topic, or disagreement over how to interpret known facts. From an economic perspective, it makes measuring or predicting variables such as GDP or inflation more difficult.


In recent years, several developments have fuelled the perception of greater economic uncertainty: the Brexit referendum, the COVID-19 pandemic, the energy crisis and, more recently, the Trump administration’s tariff escalation. Generally speaking, when we use the word uncertainty we are referring to a lack of knowledge about a particular topic, or disagreement over how to interpret known facts. In practice, it makes predicting variables sucha as GDP or inflation more difficult. Although the term usually carries negative connotations, this is not always true: the discovery of a large reservoir of a natural resource or the rise of a technology such as AI can generate positive uncertainty, in the sense that we anticipate greater growth, but we do not know for sure how much.
However, economic uncertainty is a particularly difficult phenomenon to measure. For decades, the most common way to quantify it has been based on the dispersion of the economic forecasts of different agents (consumers, business leaders and analysts). The idea is simple: the more forecasts differ from each other, the greater the uncertainty. This approach measures uncertainty when it stems from differing assessments of a known event, such as the impact of discovering an oil well.
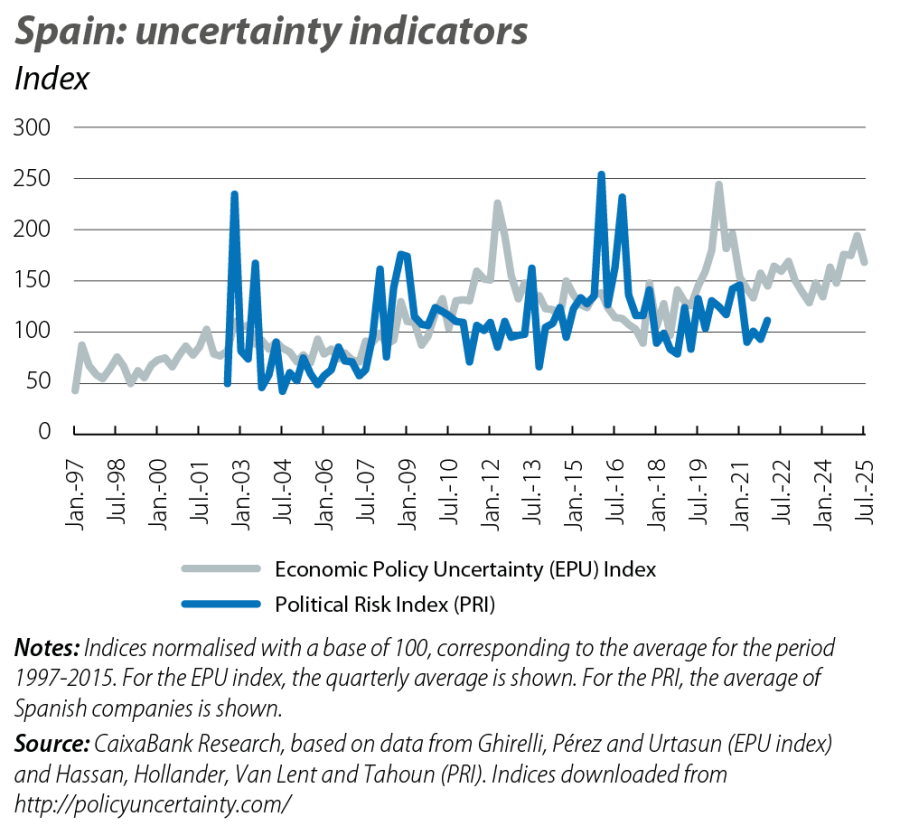
In recent years, new indicators based on text analysis have been developed which offer another way to estimate uncertainty. The best known one is the Economic Policy Uncertainty (EPU) Index, originally developed by Nick Bloom and his co-authors and expanded for Spain by the Bank of Spain. This index quantifies how often the word «uncertainty» appears (alongside economic and political terms) in the news articles of the Spanish economic press.1 On the other hand, the Political Risk Index (PRI), created by Tarek Hassan et al., employs a similar methodology but applied to transcripts of the earnings presentations of Spain’s largest companies.2 This distinction is important, as journalists and business leaders may have different concerns and therefore reflect different sources of uncertainty.
The results offered by these two indices differ markedly (see first chart). The EPU index shows sharp spikes during episodes such as the sovereign debt crisis in Spain (around 2012), the COVID-19 outbreak and, to a lesser extent, the recent rise in trade tensions between the US and the EU. It also shows a clearly upward trend since the late 1990s. It is unclear whether this upward trend reflects a structural rise in global economic uncertainty or merely greater use of the term, for example, because we are now more aware of the uncertainty that surrounds us even though in essence there may not be any structural increase. On the other hand, the evolution of the PRI does not show any clear trend and its episodes of peak uncertainty do not coincide with those of the EPU index: the PRI reached its highest values during the 2008 global financial crisis and after Trump came to power in 2016. As a result, the correlation between the two indicators is relatively low. For practical purposes, these differences mean that any estimate of the impact of uncertainty can be highly sensitive to the choice of indicator, as different indices reflect different types of uncertainty.
- 1
Specifically, the EPU index is built by counting the number of news articles in the press that simultaneously contain the words «uncertainty», «economy» and «policy», standardising this count according to the total number of articles published.
- 2
The PRI is calculated using the average level of uncertainty mentioned in corporate earnings presentations. To capture the uncertainty of a political origin, only the times that «uncertainty» appears at a maximum distance of 10 words from some political term are counted. This indicator only has data available up until Q1 2022.
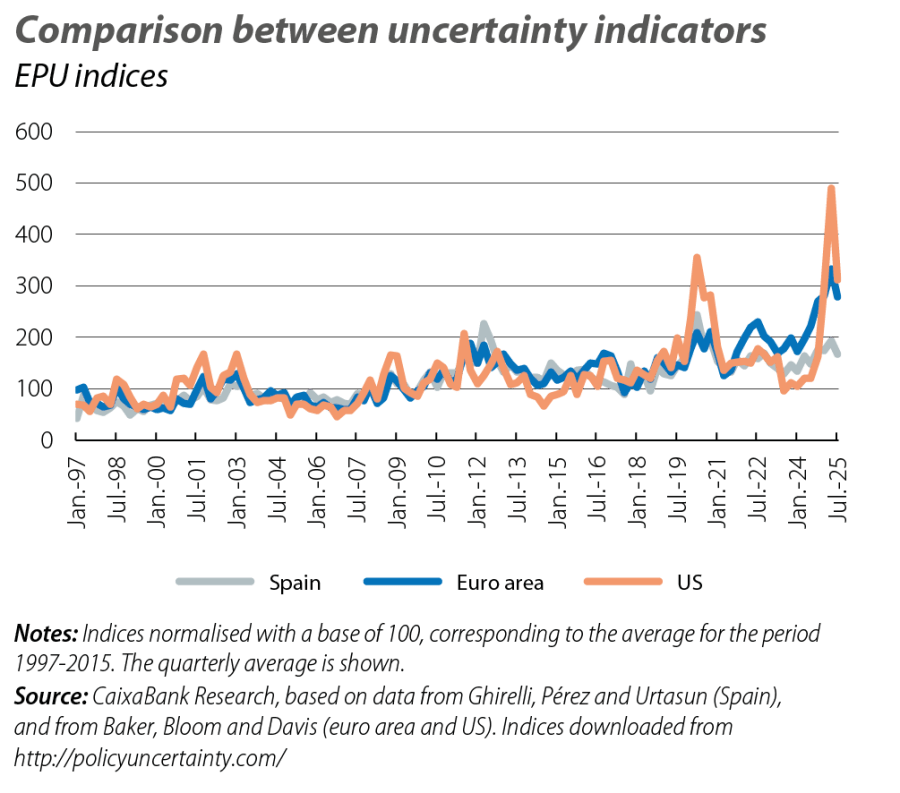
How does the level of uncertainty in Spain compare to that of other countries? The EPU index offers a clear message: in recent months, uncertainty has increased worldwide, but in Spain the increase has been more moderate than in the euro area or the US. One possible explanation for this is the Spanish economy’s relatively low trade exposure to the US.
Transmission and impact
Uncertainty constrains the economy through various channels. On the one hand, it encourages a «wait and see» approach and causes consumers and businesses to postpone their consumption, investment and hiring decisions. In addition, by being inactive, in uncertain times households and businesses may become less sensitive to market conditions such as prices or interest rates, which explains why some studies point to a loss of effectiveness of monetary policy amid heightened uncertainty.3 Moreover, episodes of uncertainty tend to coincide with turbulence in financial markets due to investors’ risk aversion. On the other hand, it also generates changes in the composition of economic activity, since it favours a reallocation of resources from activities that involve irreversible costs in favour of more reversible options: for instance, uncertainty increases the relative attractiveness of the consumption of non-durable goods or services versus durable goods, or temporary hiring versus hiring on permanent contracts.
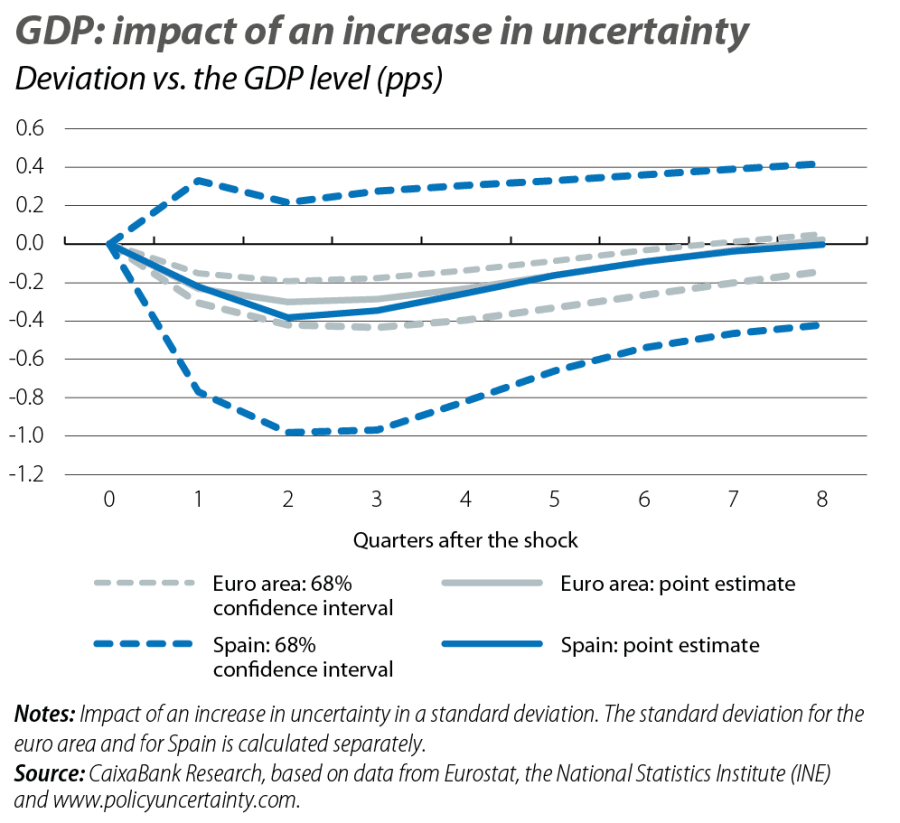
Through these mechanisms, uncertainty holds back economic activity, employment and production. Overall, the impact is greatest on investment, with a more moderate effect on consumption and employment.4 There is also evidence that uncertainty reduces credit growth and increases risk premiums.5 However, the transmission tends to be fast and, when the uncertainty dissipates, the economy can quickly bounce back thanks to the deployment of the pent-up demand in consumption, investment and hiring.
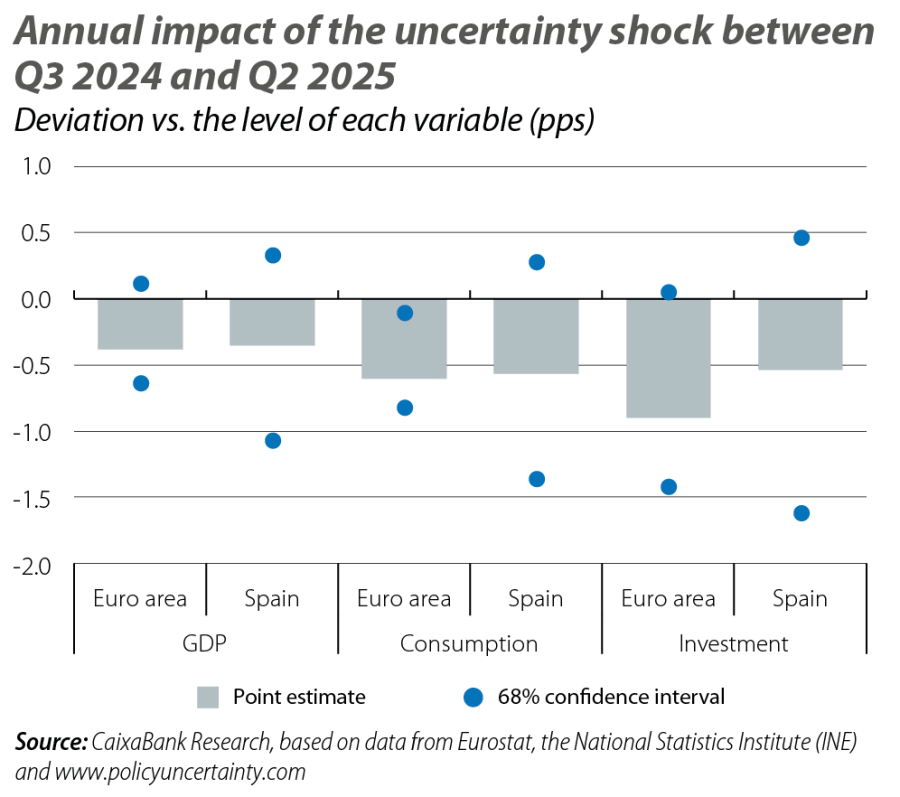
These impacts can be illustrated using the historical relationships between a measure of uncertainty and the main macroeconomic aggregates (see the third and fourth charts).6 This exercise reflects a rapid effect of uncertainty (the impact on activity peaks in two/three quarters). If we extrapolate the historical sensitivities to the surge in uncertainty experienced between Q3 2024 and Q2 2025, the episode would have deducted around 0.4 pps from the annual GDP of the euro area and Spain,7 with a greater impact on investment than on consumption, and distributed between 2025 and 2026. Beyond the main economic variables, this exercise shows that estimates of uncertainty’s impact are inherently imprecise, in the sense that the confidence interval is wide. In addition, the results are sensitive to methodological changes.
- 3
See Falconio and Schumacher (2025), Economic uncertainty weakens monetary policy transmission, ECB Blog.
- 4
See Ahir, Bloom and Furcieri (2025), «Uncertainty about Uncertainty, Finance & Development Magazine», IMF. Also Andersson et al. (2024), «What are the economic signals from uncertainty measures?», ECB Economic Bulletin 8/2024.
- 5
See Allayioti et al. (2025), More uncertainty, less lending: how US policy affects firm financing in Europe, ECB Blog.
- 6
Using quarterly data from 1997 to 2025, we estimate a vector autoregression on GDP, household consumption and gross fixed capital formation, the GDP deflator and an uncertainty measure. We make the estimate, separately, for the euro area as a whole and for Spain.
- 7
The similarity in the impact on GDP between the euro area and Spain, despite a clearly more intense upturn in uncertainty in the euro area, could suggest that Spain has a greater sensitivity to uncertainty. However, the breadth of the confidence intervals shows that the estimate of the impact in Spain is more imprecise.