Whoever has a home has a treasure
We analyse how the wealth of European households has evolved, comparing the major countries, using new experimental statistics published by the European Central Bank.


The ECB has begun publishing an experimental statistic1 that makes it possible to perform a broad analysis of how wealth is distributed in the euro area by providing disaggregated data for different tranches of wealth for the first time. Specifically, the information is broken down for each of the upper 6th, 7th, 8th, 9th and 10th deciles of net wealth, as well as for the bottom 50%.2 In this article we will show a comparison between the main countries in order to determine whether there are significant differences in the way in which household wealth is distributed, not only between countries, but also between the different tranches of the distribution. To this end, we will analyse how wealth and its main components have evolved between the beginning of the pandemic (Q4 2019) and the latest available data (Q3 2023).
- 1. https://www.ecb.europa.eu/press/pr/date/2024/html/ecb.pr240108~ ae6f7ef287.en.html.
- 2. The deciles divide the net wealth series ordered from lowest to highest into 10 equal parts and allow us to differentiate the population according to its net wealth. Thus, the lowest deciles represent the population with the least wealth, while the 10th decile represents the wealthiest portion of the population.
Since the pandemic (Q4 2019), the net household wealth3 in the euro area has increased by almost 20%. This is above all a result of the increase in net wealth in housing4 (around 24%), in a context of a significant rise in the value of this asset category (up until Q3 2023, home prices rose by more than 18%). The importance of housing as a vehicle for generating wealth in the current context of rising property values explains how homeowners have seen their wealth increase by 21%, compared to the 12% increase observed among the rental population.
- 3. By net household wealth we refer to the difference between the value of their assets (deposits, debt securities, listed shares, unlisted shares and other equity holdings, holdings in investment funds, life insurance policies, real estate and non-financial assets used for production purposes) less their liabilities (mortgage and non-mortgage loans).
- 4. Wealth in housing net of mortgage loans.

On the other hand, deposits continue to remain attractive (they represent almost 15% of total net wealth) and have grown almost 16% since Q4 2019. However, there has been a clear moderation in their year-on-year growth rate since mid-2022: in Q3 2023, they grew by just 0.3%, compared to an average rate of 3.4% in the five years prior to the pandemic. This slowdown in the accumulation of deposits is occurring despite the higher remuneration offered by this type of product. In fact, during the period from September 2015 to June 2022, deposits offered, on average, the lowest nominal return in their history (below 1.0%), whereas since the summer of 2022, and coinciding with the ECB’s cycle of rate hikes, the return offered by deposits has increased to levels not seen since 2011.
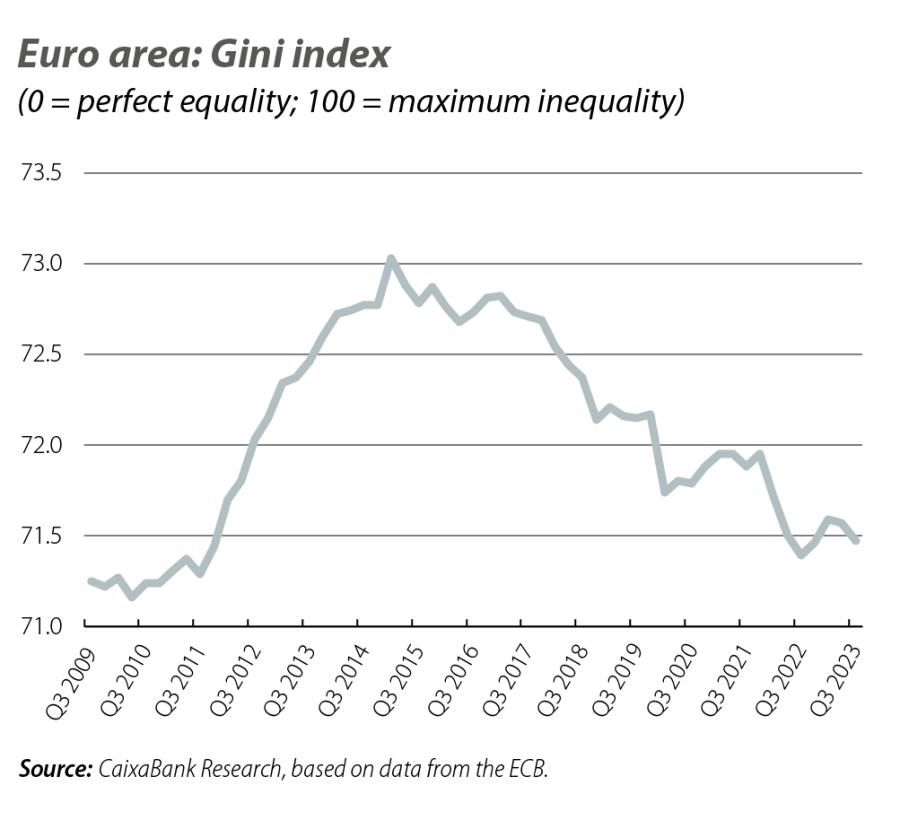
The data show that housing (net of mortgages) accounts for almost 57% of the total net wealth of households in the euro area. Moreover, it is the main component of wealth in all tranches of wealth (representing between 58% and 73% of total wealth), with the exception of households in the highest tranche, where it accounts for 47% of their total net worth. The widespread acquisition of housing in recent years has enabled an increase in net wealth across all tranches.5 In fact, net wealth among the population in the bottom half of the distribution increased by 28%, compared to an increase of less than 19% in the richest portion of the population. This has contributed to a modest reduction in wealth inequality within the bloc, although it still remains high: the Gini index has fallen to 71.5% in Q3 2023, from 72.2% prior to the pandemic.
- 5. The ECB offers the wealth distribution by decile for the aggregate population, but not separately for homeowners or renters. However, as we have already pointed out, the data show that the increase in wealth among homeowners has been much greater than among the rental population.
As for deposits, they represent over 15% of the total net wealth of the euro area, although this figure varies widely depending on the degree of wealth: among less wealthy households, deposits represent more than 40% of their wealth, while for the population with medium and medium-high wealth it represents between 17% and 20%; falling to 11% in the case of the richest group. On the other hand, life/savings insurance policies6 account for around 8.0% of wealth in the euro area, rising to 9.7% of household wealth for the bottom 50% and 9.0% in the case of the wealthiest groups. It is also apparent that more sophisticated financial investment instruments (such as listed shares and/or investment funds) account for around 20% of total wealth in the euro area, although these figures are only significant in the composition of the wealth of the richest 10% of the population.
- 6. This form of savings is particularly common in Germany and France. It consists of a savings method in which the policyholder receives the income from the insurance policy after retiring; or, if they die before reaching retirement age, the insurance premium is received by their beneficiaries.

The data show that wealth inequality in the euro area has declined modestly in recent years thanks to the substantial increase in the value of housing, an asset class which accounts for a particularly large portion of the wealth of households in the bottom half of the distribution. There are also significant differences in the composition of household wealth. In the less wealthy half of the distribution, this wealth consists of housing and low-risk assets (deposits and life/savings insurance policies), while the wealth structure of the richest households includes a much higher proportion of more sophisticated financial instruments. This clear difference between households can affect the transmission of monetary policy, as has been demonstrated in multiple studies. We must therefore begin to consider that the functioning and the effectiveness of monetary policy measures depend on the distribution and structure of wealth, as one member of the ECB already acknowledged some time ago.7
- 7. Dinner address by Peter Praet, member of the ECB Executive Board, ECB Conference on Household Finance and Consumption, Frankfurt am Main, 17 October 2013.
Inequality & inclusive growth
We analyze the causes and consequences of inequality and what policies can foster inclusive economic growth that is distributed equitably in society.