Jay Gatsby’s American Dream: between inequality and social mobility
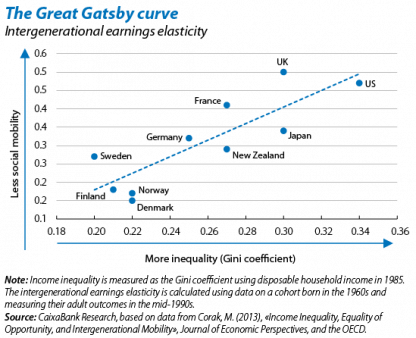
In Spain, the richest 1% of the population earns 8.6% of the country’s income while this figure reaches 20.8% in the US. Are such high levels of inequality desirable or detrimental? Ultimately such a question must be answered by each country according to its own social preferences and values. However, the answer also depends on the equality of opportunities offered by the economy. According to the American Dream, US citizens are more likely to put up with inequality because they see it as the price paid for an economy in which anyone, irrespective of their status in society, has the chance to climb the social ladder through their own hard work and talent. This world view implies a greater tolerance of inequality so long as it is positively associated with social mobility. The data, however, appear to contradict the American Dream: as shown by the first chart, the most unequal countries have less social mobility. Let us take a look at the reasons for this situation.
The large impact of the first chart in media outlets has led it to be popularly known as the «Great Gatsby curve», in reference to the society of the Roaring Twenties. It is worth taking a closer look at the figure. The horizontal axis shows inequality represented by the Gini coefficient, which indicates whether income is equally distributed (values close to zero) or is owned by a small group (values close to one). The vertical axis is a measure of intergenerational social mobility: namely, the intergenerational earnings elasticity, which indicates the extent to which a cohort of children’s income depends on the income of their parents (higher values suggest adult earnings are more closely linked to the parents’ earnings at the same age).1 Although the association expressed by the Great Gatsby curve is statistical and does not demonstrate cause and effect, the relationship is surprisingly clear and, more importantly, can be seen across countries with a similar level of economic development. There is also evidence that this relationship holds across time within the same country (in particular, in the US). For instance, Olivetti and Paserman (2015)2 document a reduction in social mobility between 1870 and 1920, coinciding with an increase in the national income owned by the richest 1% of the population. Along the same lines, and also in the US, Chetty et al. (2016)3 estimate that the decline in absolute social mobility between 1970 and 20144 was mainly due to an increase in inequality. In other words, under the current distribution of GDP and solely via economic growth, we would need real GDP growth rates above 6% per year, over 30 years, to return to the rates of absolute mobility seen in the 1940s. Finally, Chetty and his co-authors (2014)5 have also shown that those US cities with the highest income inequality are also the cities with the lowest social mobility. However, in a comparative study across cities, Chetty et al. (2014) find evidence that not all types of inequality are related to social mobility in the same way. While the relationship is strong when measured via the Gini coefficient, at the city level no significant correlation is observed between social mobility and the earnings of the top 1%, suggesting that factors affecting the middle and lower classes are more important.
In order to analyse the link between inequality and social mobility more closely, it is useful to interpret social mobility as a mechanism that transmits inequality from one generation to the next. The family, the market and the state are the three large institutions that determine transmission between social mobility and inequality. Based on a family’s socioeconomic status, a child’s cognitive, emotional and social development moulds her capacity to learn and, hence, her educational attainment. In turn, these determinethe labor market outcomes of the child (the likelihood of finding a job, the job’s characteristics, etc.), influencing her emotional wellbeing and socioeconomic status as an adult, and thereby establishing a new environment for the next generation. Throughout this cycle, public policies may also affect people’s lives with mechanismssuch as the public education system or taxation and transfers.
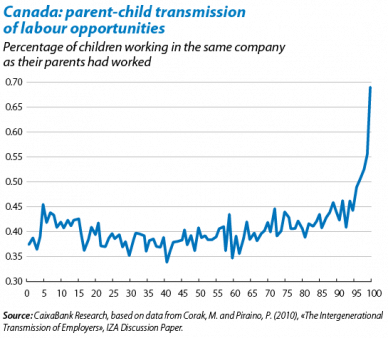
The family determines the cognitive and social development of children at an early age. Decades of research in the fields of psychology and neuroscience have shown that experiences during the earliest years of life have a persistent impact on people’s socioeconomic status as an adult because they affect the architecture, biochemical composition and genetic expression of neuronal circuits that are key to defining cognitive, emotional and social skills. Moreover, the evidence indicates that it is much more difficult for later life experiences to reverse the effect of the early years of life.6 In this respect, the socioeconomic level of families determines their capacity to invest in their children, both in monetary terms (books, computers, private schools, extracurricular activities, summer camps, etc.) and non-monetary (passing on contacts and reputation). US data show that the richest families spend an average of over USD 9,000 per child on products and services to promote their cognitive and emotional development, almost seven times more than families with the fewest resources.7 Inequalities across families also determine access to education and the labour market. For instance, although statistics show that, once someone has graduated from college, the likelihood of them having a low, medium or high income is less dependent on their parents’ income, access to higher education itself is biased against lower-income families. In the US, for example, over 50% of children from the highest-income families get a university degree while this figure falls to 7% among the lowest-income families.8 Similarly, the second chart shows how parents’ experience in the labour market helps their children to get a job, especially among the highest earners. Although the chart shows the case of Canada, there is similar evidence for other countries such as the US and Denmark.9
But the family is not the only determining factor for personal development. The findings of the study by Chetty et al. (2014) indicate that the characteristics of the area in which children live have the strongest explanatory power for differences in social mobility across cities. A larger fraction of single-parent families, lower social capital rates,10 higher residential segregation by race and income and a lower-quality educational environment are associated with less mobility. Furthermore, it is important to note that these characteristics influence the social mobility of all those living in the area; children from two-parent families also have statistically less social mobility if they live in a zone with a high fraction of single-parent families. In fact, possibly the best illustration of this «neighbourhood effect» is the fact that social mobility is higher in more compact cities (i.e. where less time is taken up with commuting).
In conclusion, inequality and social mobility are closely linked because inequality helps to define the framework of opportunities for the next generation and amplifies the future consequences of the environment in which people are born. Thus, if one is concerned about the inequality of opportunity, she should also pay attention to the inequality of outcomes.
Marta Guasch Rusiñol and Adrià Morron Salmeron
CaixaBank Research
1. For a more precise definition, see the article «Social mobility: up or down?» in this Dossier.
2. See Olivetti, C. and Paserman, M. D. (2015), «In the Name of the Son (and the Daughter): Intergenerational Mobility in the United States, 1850-1940», American Economic Review.
3. Chetty et al. (2016), «The Fading American Dream: Trends in Absolute Income Mobility since 1940», NBER Working Paper.
4. Absolute mobility is defined as the percentage of children who, as adults, have a higher income than their parents. The cohorts range from children born in 1940 to those born in 1984 and their income is measured when they are 30. See the article «Social mobility: up or down?» in this Dossier for a more precise definition of absolute social mobility.
5. Chetty et al. (2014), «Where is the Land of Opportunity? The Geography of Intergenerational Mobility in the United States», NBER Working Paper.
6. Knudsen et al. (2006), «Economic, neurobiological, and behavioral perspectives on building America’s future workforce», Proceedings of the National Academy of Sciences of the USA.
7. See Duncan, G. and Murnane, J. (2011), «Whither Opportunity?: Rising Inequality, Schools, and Children’s Life Chances», Russell Sage Foundation.
8. See Bengali, L. and Daly, M. (2013), «U.S. Economic Mobility: The Dream and the Data», FRBSF Economic Letter.
9. See Corak, M. (2013), «Income Inequality, Equality of Opportunity, and Intergenerational Mobility», Journal of Economic Perspectives, vol. 27, no. 3.
10. Social capital is measured with indicators such as electoral participation and the percentage of individuals who form part of local civic organisations.


