The medium-term potential growth of Spain’s GDP
In this article, we focus on analysing the past evolution and future outlook for potential GDP growth. This is a key variable, since it offers an indication of our economy’s underlying growth trend.In other words, it tells us how much the economy can grow by in a sustained manner in the absence of shocks if all of the economy’s productive capacity is used and no imbalances arise.


The last four years have borne witness to a series of events that we could call «extreme»: first, COVID-19; then, the outbreak of the war between Russia and Ukraine, and more recently the conflict between Israel and Hamas. These events have left little room for analysis of the underlying trends in our economy. In a series of recent Focuses we have addressed more structural aspects such as the evolution of productivity, both on aggregate and at the sector level, and the evolution of the structural unemployment rate.1 In this article, we focus on analysing the past evolution and future outlook for potential GDP growth. This is a key variable, since it offers an indication of our economy’s underlying growth trend. In other words, it tells us how much the economy can grow by in a sustained manner in the absence of shocks if all of the economy’s productive capacity is used and no imbalances arise. However, quantifying an economy’s potential GDP growth is no easy task. This is a variable that cannot be directly observed and estimating it is shrouded in uncertainty.
- 1. See the articles «Productivity in Spain: a lot of scope for improvement», «Sectoral specialisation penalises the productivity of the Spanish economy» and «How could structural unemployment be further reduced in Spain?», in the MR10/2023, MR11/2023 and MR01/2024, respectively.
There are several ways to estimate potential GDP. In this article, we opt to use the production function approach. According to this methodology, GDP can be modelled as a function of a set of production factors, typically labour, capital and so-called total factor productivity (TFP).2 Once we establish this relationship, it can be shown that GDP growth is equal to the growth of TFP plus the weighted sum of the growth of labour and capital.3
We measure the labour factor as the number of hours worked in the economy. In turn, the hours worked can
be broken down into four variables: the hours worked per employee, the employment rate (which is equal to one minus the unemployment rate), the activity rate and the working age population (between 16 and 64 years of age).4 Since the goal is to measure potential GDP, we take the structural unemployment rate rather than the observed rate.5 The above breakdown allows for a better understanding of the key factors that lie behind the evolution of the number of hours worked.
In the case of the growth of capital, this is measured by summing up the gross fixed capital formation over the stock of capital each year, after deducting the depreciation of the stock of capital.6
TFP is obtained as a residual amount, i.e. the difference between real GDP growth and the weighted sum of labour and capital growth. TFP captures everything else that causes production to grow in excess of what would be allowed by the sum of the production factors specifically considered (labour and capital). In this regard, TFP captures productivity gains, but it can also capture other dynamics such as an inaccurate measurement of the specific production factors. In particular, since the labour factor in our model only takes into account the change in the number of hours worked, our estimate of TFP includes changes in the quality of the labour factor, which, according to other analyses, has improved considerably over the last few decades.7
Finally, once we have obtained the evolution of TFP, the labour factor and the capital factor, we then determine the potential underlying trend values for each variable, before using these values to estimate the evolution of potential GDP.8 Of course, the observed GDP may be less than or greater than the potential GDP. If the observed GDP is below potential GDP, this means that there is an underutilisation of the economy’s capacity, and vice versa. As an example, consider the period between 2009 and 2012, which was affected by the financial and sovereign debt crisis. During this period, potential GDP fell as the shock that affected our economy reduced its productive capacity. However, the observed GDP fell to a greater extent than potential GDP, suggesting that, beyond the loss of productive capacity to which our economy was subjected, there was also an underutilisation of productive resources.
In this article we will focus on calculating the growth of potential GDP, rather than determining its level. Thus, if the growth of observed GDP is greater than that of potential GDP, this can suggest that either the gap between observed and real GDP is closing (because there was a negative gap) or, on the other hand, that it is widening (because the gap was already positive) and the economy is overheating.
- 2. In this article, we talk about three production factors. However, the literature has analysed more complex cases where more factors are explicitly considered, such as human capital.
- 3. The weighting is based on the weight of income from labour and from capital relative to GDP.
- 4. The activity rate is defined as the sum of the unemployed and the employed over the working age population (16-64 years).
- 5. We define the structural unemployment rate as the unemployment rate that is compatible with inflation close to the central bank’s target. The structural unemployment rate is not observable and has to be estimated.
- 6. We obtain the depreciation rate from the rates associated with each subcategory of the stock of capital, weighting them according to each subcategory’s relative weight in the total stock.
- 7. Bontadini et. al. (2023), «EUKLEMS &INTANTProd: industry productivity accounts with intangibles», offers an estimate of the impact of the increase in the quality of the labour factor.
- 8. To obtain the underlying trend values, we use the Hodrick-Prescott filter.
What are the growth assumptions for each of the components that make up our forecast of the number of hours worked?
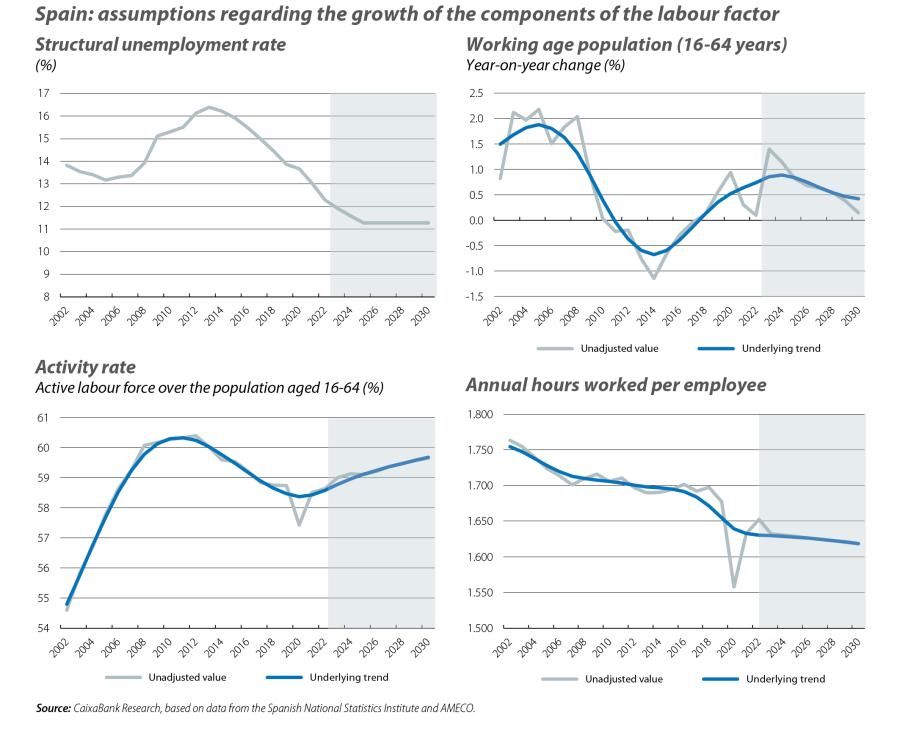
The first chart shows the assumptions regarding the evolution of the structural unemployment rate, the working age population, the activity rate and the hours worked per employee.
For the structural unemployment rate, we take the European Commission’s forecast, which goes up to 2025 and assumes that the structural unemployment rate will reduce to 11.3%. From there on, we assume that the rate will remain flat at this level; this could be considered a conservative assumption, given that the structural unemployment rate could plausibly continue to fall. For the dynamics of the working age population, we take the demographic projections of Spain’s National Statistics Institute (which for 2030, for example, assume a growth of 0.15%). In the case of the activity rate, we assume a slight increase within the projection horizon, while for the number of hours worked we take as a reference the average annual decline recorded between 2014 and 2019 (–0.12%).
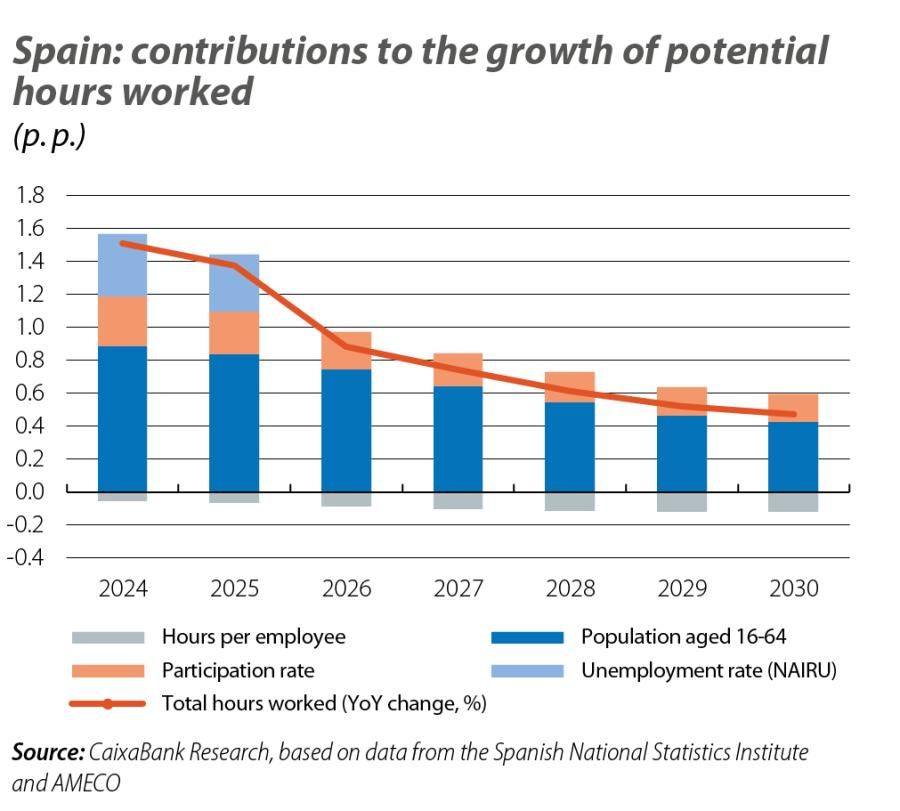
Based on these assumptions, the second chart shows the projected growth of the number of hours worked between 2024 and 2030, and the breakdown of the contributions of each component. Initially, the hours worked are favoured by a decrease in the structural unemployment rate. However, from 2026, based on the assumption that this rate will stabilise, this factor fades. Thereafter, the demographic trends gain prominence and give rise to a gradual but sustained moderation in the growth of the number of hours worked, as a result of the slowdown in the growth of the working age population.
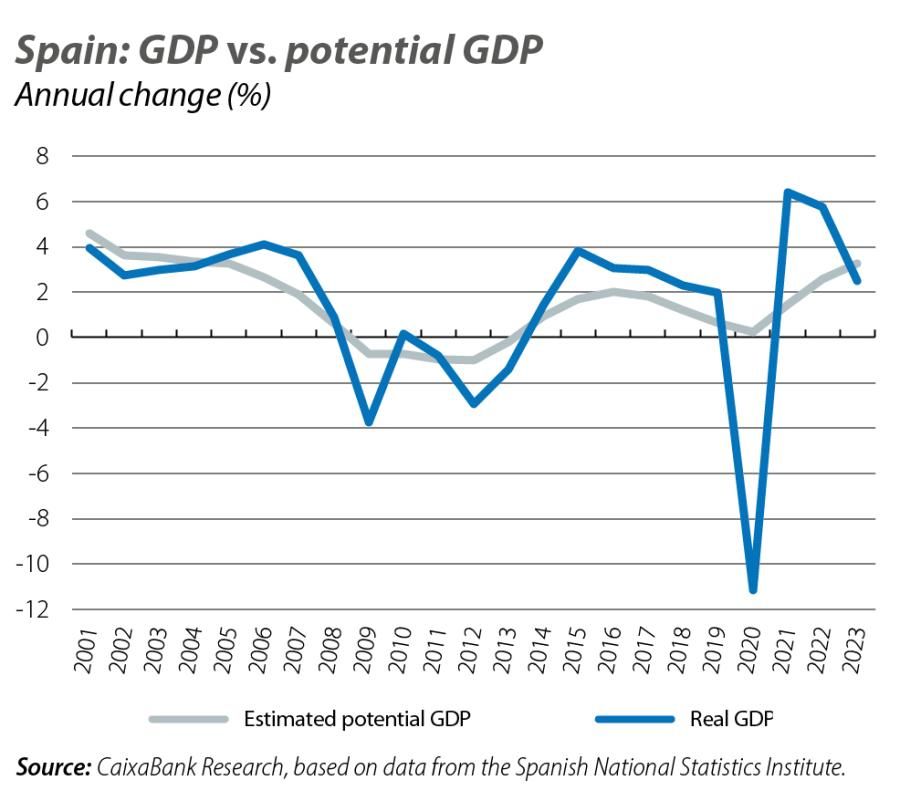
The third chart shows the comparison between the evolution of potential GDP growth since the beginning
of the millennium, according to our estimate, and that of the observed GDP. During the 2020 pandemic, potential GDP growth fell, albeit less than the observed GDP growth.9 This more contained fall in the potential GDP growth is attributed to the fact that, according to our model, the sharp decline in the number of hours worked and in investment are considered to be short-lived events. From 2021, potential GDP growth has recovered and we estimate that it peaked in 2023.
- 9. The Bank of Spain and the European Commission obtain similar results. The Bank of Spain estimates a potential GDP growth in 2020.
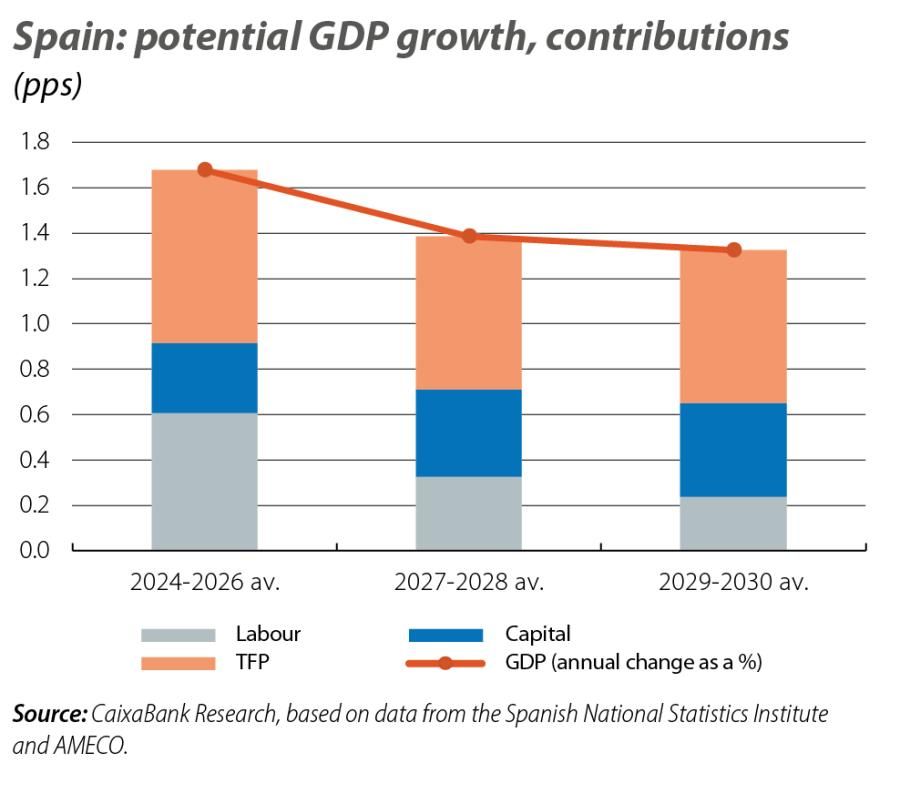
In the fourth chart, we present our projections for potential GDP growth from 2024 to 2030, and we detail the contribution of the various factors. Overall, we expect the potential growth of the economy to oscillate around 1.7% in the three-year period between 2024 and 2026, before gradually declining to 1.3% in 2030. Our forecast assumes that the growth of TFP will rapidly return to its historical average of 0.7% per year within the projection horizon. We observe a gradual decrease in the contribution of the labour factor, due to the demographic factors mentioned above, which is partially offset by an improvement in the contribution from capital. After the low level of investment recorded between 2021 and 2023, we expect to see a certain recovery in the coming years, and this should boost the contribution to growth that comes from the capital factor. Our forecast for medium-term potential GDP growth of 1.3% is similar to that offered by other institutions. For instance, the Bank of Spain estimates a potential growth of 1.1% in 2030 in the absence of European NGEU funds, although taking the NGEU funds into account it increases that forecast up to the 1.3%-1.9% range, depending on the assumptions regarding the impact of the funds. The AIReF, for its part, estimates a potential growth of 1.3% in the medium term (from 2028 onwards).10
- 10. See Pilar Cuadrado et. al. «El crecimiento potencial de la economía española tras la pandemia», nº 2208, Bank of Spain, 2022, and the «Report on the main budgetary lines of the public administrations
for 2024», by the AIReF.
The uncertainty surrounding forecasts for potential GDP growth is high due to several factors, ranging from technical issues in the measurement and specification of the model, to the underlying assumptions used in the forecasts. To exemplify the uncertainty surrounding this last point, we considered two sensitivity exercises.
• The first examines the effect that a greater reduction in the structural unemployment rate would have. Specifically, if we assume that it will continue to decline beyond 2025 at a rate of 0.3 pps per year,11 this change would bring the structural unemployment rate slightly below 10% in 2030 and would increase the potential growth of the economy by 0.2 pps to 1.5% in 2030.
• The second exercise considers a scenario with a higher rate of investment growth.12 In particular, in this scenario it is assumed that investment will grow by 1 pp more each year through to 2030. If this scenario were to materialise, then potential GDP growth would gradually increase, reaching 1.5% in 2030. This increase could be greater still if, in addition, the effect that it could have on the economy’s productivity growth is taken into account.
To summarise, we anticipate that the potential growth of Spain’s economy will be 1.7% on average between 2024 and 2026, but that from then on it will moderate due to demographic factors, reaching 1.3% in 2030. In view of the prospect of somewhat moderate medium-term potential growth, it is imperative to propose structural reforms that will boost investment, improve the efficiency of the labour market and foster greater productivity growth.