Sectoral specialisation penalises the productivity of the Spanish economy
Why is productivity so low in Spain and why has it grown so little in recent years? Although the answer is complex and a whole range of factors are involved, two of the key causes of the Spanish economy’s low labour productivity, as well as the low growth thereof, are the country’s production specialisation and the small size of its companies.

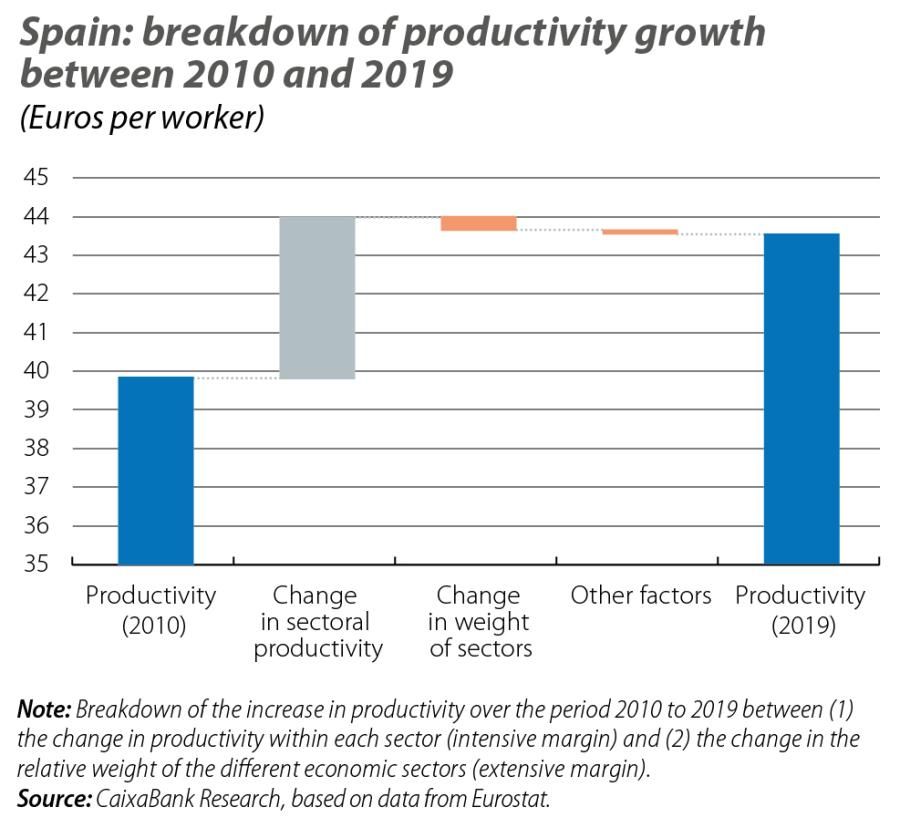
Labour productivity in Spain increased by 9.3% between 2010 and 2019 (an average of 1.0% per year).1Productivity growth was widespread across the vast majority of economic sectors, as demonstrated by the fact that 82% of Spanish workers are employed in sectors that have experienced labour productivity growth in the period analysed. However, both the level of productivity and its growth rate remain modest compared to other euro area countries, such as Germany.
- 1. In this Focus, we analyse the sectors that make up the market economy, with the exception of agriculture and financial and insurance activities. Specifically, we include sections B-J and L-N of the National Classification of Economic Activities (known as the CNAE), the GVA of which represents 45% of total nominal GDP in Spain (55% in Germany). The data are drawn from Eurostat’s structural business statistics and are available up until 2020, but we take 2019 as a final benchmark in order to avoid the distortions in production and employment that occurred due to the pandemic.
Productivity in the economy as a whole can be improved either by boosting productivity in each individual sector or by shifting employment from sectors with relatively low productivity to those with higher productivity. If we break down the increase in productivity over the period 2010 to 2019 between these two factors, we see that the entirety of the improvement was due to productivity growth occurring in practically all sectors (see grey bars in the first chart).
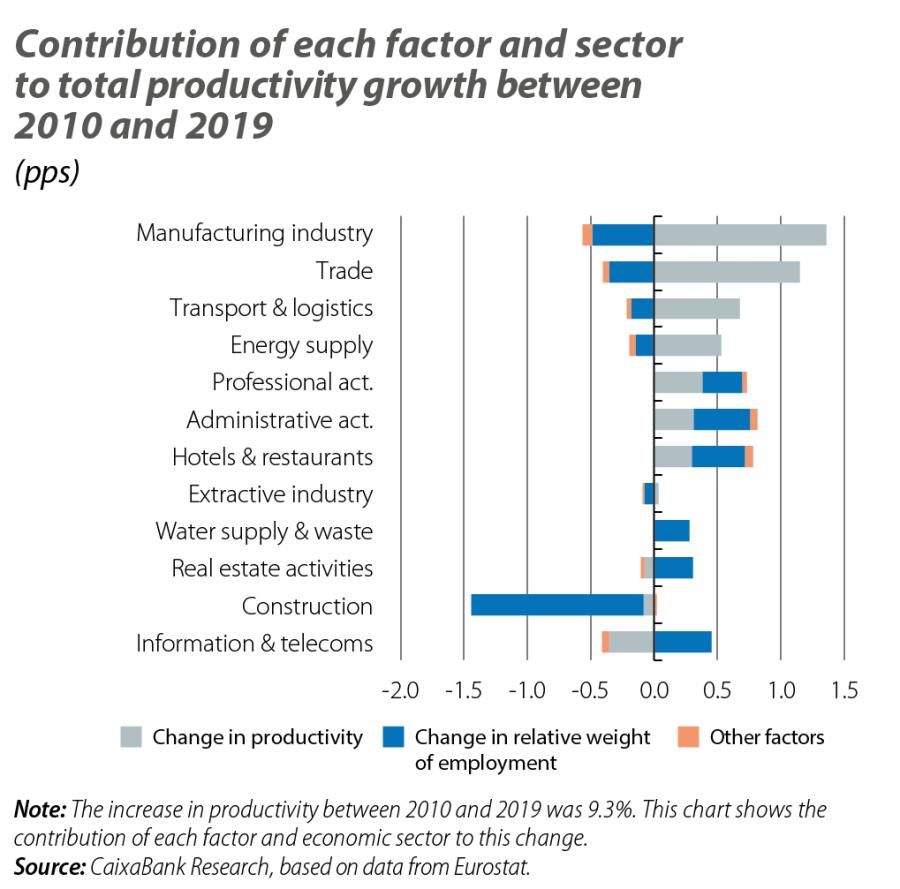
The manufacturing industry contributed the most to productivity growth between 2010 and 2019, managing to increase its Gross Value Added (GVA) by 18.2% with only a 2.5% increase in the number of workers. The trade, transport and logistics, and energy supply sectors also made a significant contribution.2 The hotels and restaurants sector, as well as professional and administrative activities, also made positive contributions to productivity growth, albeit to a lesser extent.
Another highly productive sector (second only to the energy supply sector) is that of information and telecommunications. However, its contribution to total productivity growth between 2010 and 2019 was negative because the increase in employment in the sector (24.8%) was much higher than the increase in its GVA (10.1%). The construction and real estate sectors also registered a decline in productivity during this period.3
- 2. The energy supply sector experienced the highest increase in productivity between 2010 and 2019 (38.4%). It also significantly increased its GVA (34.5%), despite a reduction in the number of people it employed (–2.8%).
- 3. In the case of construction, the decline in productivity is explained by the fact that GVA fell by more than employment (–20.8 and –19.4%, respectively). In the case of real estate activities, the sharp rise in employment (40.4%) far exceeded the increase in GVA (29.7%).
The answer is that it has not done so across the board. In fact, the change in the sectoral composition of employment has subtracted 1.2 pps from productivity growth during this period. In other words, we estimate that the productivity of the Spanish economy would have been 1.2% higher in 2019 if the production specialisation of 2010 had been maintained.
This result is mainly explained by a reduction in the proportion of total employment found in the manufacturing industry,4 a sector in which productivity per worker is 39% higher than for the economy as a whole. Among the sectors with relatively high productivity (above average), employment in the extractive and energy supply industries has also declined as a proportion of the total. In contrast, sectors with a relatively lower level of productivity, such as hotels and restaurants or administrative activities, have registered an increase as a proportion of total employment.5 Thus, despite the impressive productivity gains in these two sectors during this period (14.6% and 12.7% respectively, above the average of 9.3%), the fact that these low-productivity sectors have gained so much relative weight in the mix of total employment limits the economy’s aggregate productivity gains.
- 4. Employment in manufacturing has gone from representing 16.9% of the total in 2010 to 15.9% in 2019 (–1 pp).
- 5. The relative weight of employment in the hotel and restaurants industry has increased from 10.3% in 2010 to 12.4% in 2019 (+2.1 pps), while in the case of administrative activities it has gone from 10.2% to 12.0% (+1.8 pps).
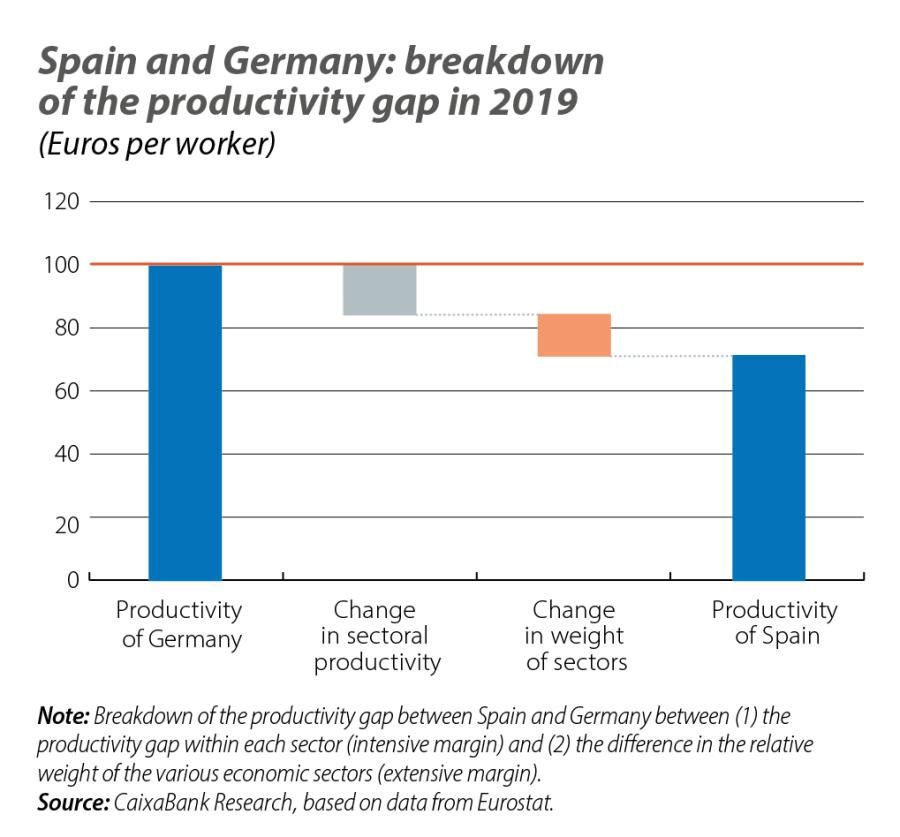
As we have seen, between 2010 and 2019, apparent labour productivity in Spain increased by 9.3%. This increase, however, is much lower than the 16.7% recorded in Germany in the same period. As a result, the productivity gap between Spain and Germany widened during this period: whereas in 2010 productivity in Spain was 23.4% lower than in Germany, in 2019 this gap had grown to 28.2%.
Again, if we break down the productivity gap between Spain and Germany in 2019 between (i) the productivity gap within each sector (intensive margin) and (ii) the difference in the relative weight of the various economic sectors (extensive margin), we observe that much of the difference is explained by the lower productivity of most Spanish sectors (the only exceptions are hotels and restaurants, transport and logistics, and energy supply, where the labour productivity in Spain is higher than that of Germany). However, the relative weight of the various economic sectors also plays a significant role (this factor explains 40% of the productivity gap between the two countries).
To a large extent, the gap is due to the significant role of Germany’s manufacturing industry in the economy in 2019 (accounting for 26.1% of employment and 34.5% of GVA) compared to that of Spain (15.9% of employment and 22.2% of GVA). On the other hand, in Spain, both the hotels and restaurants sector and trade have a much higher relative weight than they do in Germany. In particular, we estimate that the productivity of the Spanish economy would be 15.9% higher if it had Germany’s production specialisation. In other words, the productivity gap would be reduced from 28.2% to 16.8% (Spain’s productivity would be 83.2% of Germany’s).
Another important aspect of Spain’s sectoral composition which contributes to lower productivity is the distribution of the size of companies in the economy. It is the case in all countries that larger companies tend to be more productive than those with fewer workers. This distinction is particularly relevant when comparing Spain with Germany: Spanish micro-enterprises (from 0 to 9 workers) are the main employers in market sectors (accounting for 35.5% of employment in 2019 compared to 18.6% in Germany). In contrast, the relative weight of employment in large German companies (with over 250 workers) stands at 42%, compared with 32% in Spain.
If, in addition to the sectoral composition, we also take into account the different size of the companies in each economy, we estimate that the productivity of the Spanish economy would be 28.6% higher if it had both Germany’s sectoral specialisation and its company size. In this case, the productivity gap would be reduced to 7.7%, compared to an observed gap of 28.2%.