Is there «early» evidence of de-risking? (part I): the US and China
We continue to analyse the phenomenon of de-risking among the major economic powers in a new instalment of articles dedicated to international trade and geopolitics. In this first article, we will focus on the United States and China, and in a second edition, on the European Union.

Since 2008, global trade flows have virtually stagnated. At the same time, the significant rise in trade tensions between countries, mainly since 2018 and with the US-China axis at the epicentre, is leading to a redesign of trade flows. The key question is whether, in the face of rhetoric and policies more focused on bolstering «economic security», there is any evidence that trade ties (or «dependencies») between the major economic blocs have systematically diminished.
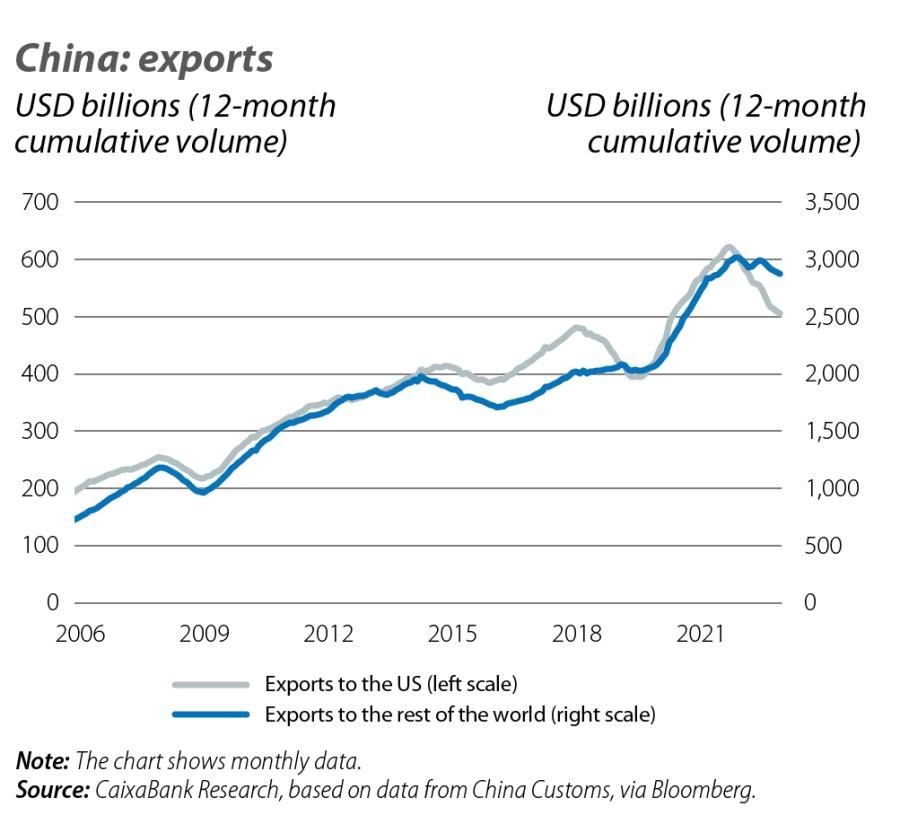
Since the end of 2018, China’s exports to the US have suffered a zigzag pattern, with contractions in 2019 and 2022-2023, but reaching all-time highs in between (see first chart). However, since 2018 China has lost almost 5 pps in its share of total US imports, while countries such as Mexico and Vietnam, and even the euro area, have seen their share increase.
For instance, between 2018 and 2021, Vietnam’s annual exports to the US have more than doubled (increasing by over 50 billion dollars per year). Looking at the breakdown by sector, while the proportion of exports of electronic products from China to the US fell by 2 points in the period, exports of these products from Vietnam to the US rose by 13 points (see first table).1 China’s exports to Vietnam have grown by almost 70% (also around 50 billion dollars per year) and flows within the electronics sector have intensified in both directions.
- 1. In contrast, between 2018 and 2021, US exports to China have increased by almost 30%, and to Vietnam, by 10%.
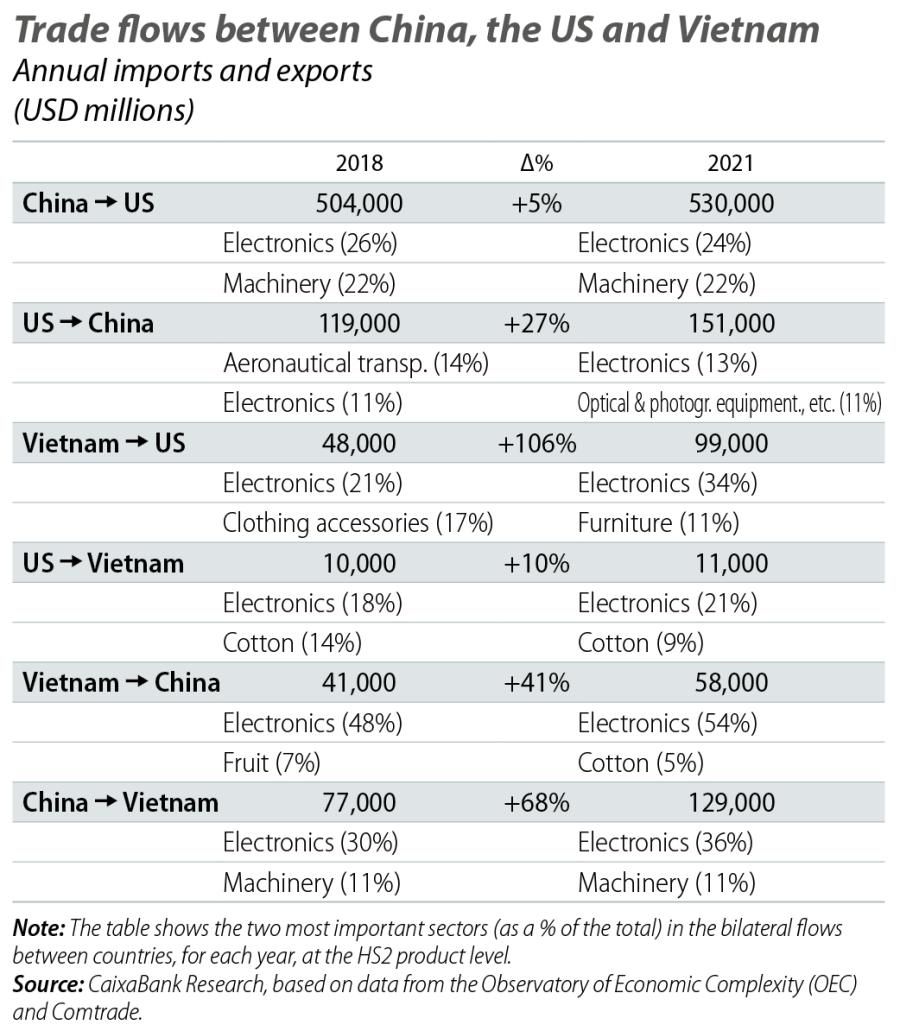
The «trade triangle» between these countries reveals that, despite direct trade ties between China and the US having steadily weakened over the period, indirect ties may have increased significantly.2 If we understand the objective of de-risking (i.e. minimising risks in value chains through the diversification of trade flows) to be a reduction in the effective trade dependence between countries, and this depends on both direct and indirect trade ties, it is not clear to what extent there has really been a decoupling between the US and China since 2018, despite the significant increase in tariffs imposed by the two countries.3 This is also shown by is demonstrated by one of the most famous theorems of Euclidean geometry, attributed to the Greek philosopher and mathematician Pythagoras, in the 6th century BC: the square of the length of the hypotenuse is equal to the sum of the squares of the length of the other two sides.
- 2. Although China has seen its share of total US imports decline, it remains the US’ biggest trading partner in terms of imports, accounting for one fifth of the total. On the other hand, China is also the main source of Vietnam’s imports. While in 2018, 31% of Vietnam’s total imports of goods came from China, in 2021 this figure stood at 39%. The main product imported by Vietnam is integrated circuits (12% of total imports). In 2018, 23% of the integrated circuits imported by Vietnam came from China (compared to 46% from South Korea and 6% from the US and from Japan). In 2021, China’s share rose to 33% (33% from South Korea, 7% from Japan and 4% from the US).
- 3. In order to clearly identify «dependencies» between economies through global value chains, international value-added data must be used, which are available, for example, in the OECD TiVA database. Such data make it possible to identify the true origin of the goods and services that arrive, are consumed and are exported in a given country, taking into account that the gross flows of imports and exports between countries incorporate content originating in multiple locations. However, due to the complexity of this data, they are published with a lag of several years.
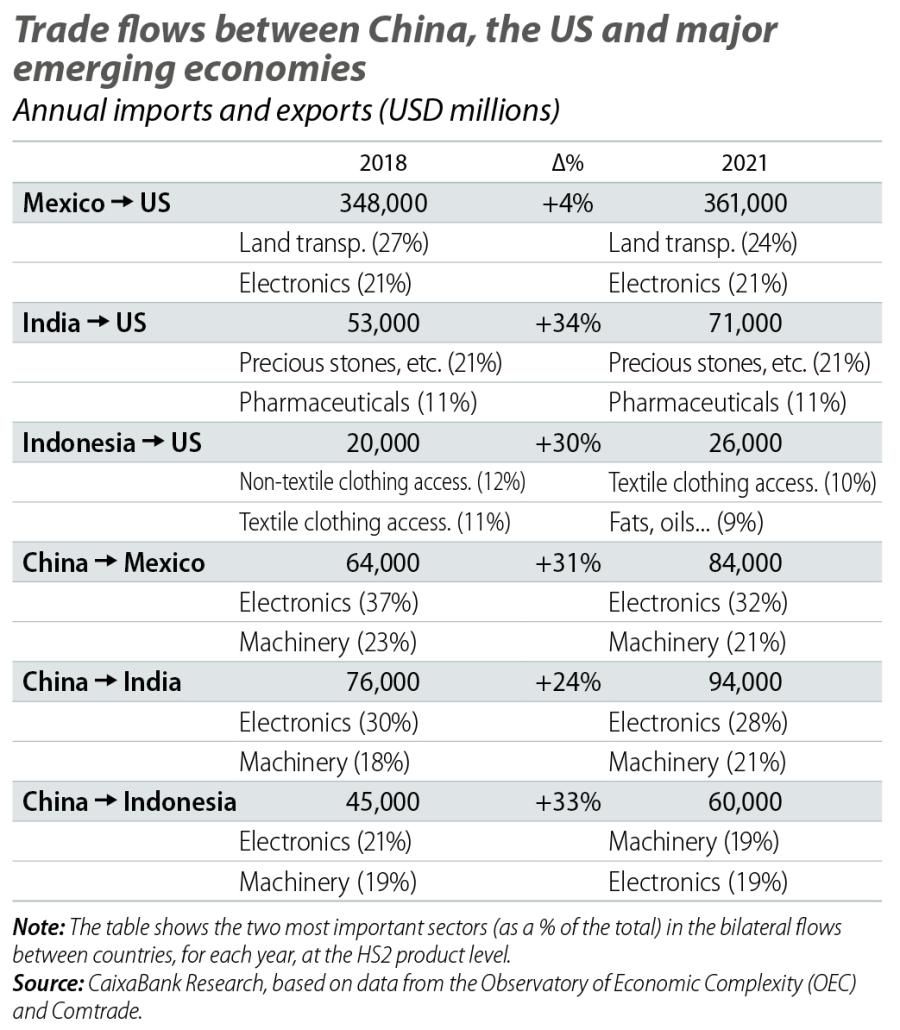
While on the one hand the intensification of Vietnam’s trade flows with China and the US will have countered, at least in part, the relative weakness of the direct flows between China and the US, it remains to be seen whether these trade flow deviations spread to other countries. Focusing on the Asian region and other large emerging economies, in the same period we see more rapid growth in US trade flows with other ASEAN countries (such as Indonesia, Malaysia and Thailand), as well as with South Korea and Taiwan, all registering growth in excess of 30%. Trade flows with India have also grown by more than 30%, while flows with Mexico and Brazil stagnated between 2018 and 2021.
Various nuances in these cases help us to understand the challenges and complexity of the de-risking process between major economic powers. On the one hand, although we see a reduction in US imports coming from China and an increase in those coming from other countries, these countries have increased their own imports originating in China. Therefore, we cannot decisively conclude that the US’ indirect trade links with China have not increased. In virtually all of the cases mentioned above, the growth of these countries’ imports coming from China has practically matched, or even surpassed, the growth of their exports to the US (see second table). On the other hand, in the case of India, which has registered a 34% increase in its exports to the US in the period, although the country’s imports from China have grown by 24%, it is not clear that this channel has led to a de-risking for the US relative to China. Firstly, the annual flows of exports from India to the US are only one seventh of those from China to the US (and they are even inferior to those from Vietnam to the US). Secondly, India and China have very different sectoral specialisations. Whereas almost 50% of China’s exports to the US (and to India) are electronics and machinery, India’s main exports to the US include precious stones and metals (20%) and pharmaceuticals (10%), while electronics and machinery together account for just over 10% of the total.
The use of «defensive» trade policies such as tariffs, unilaterally and as a weapon for negotiating with trading partners, has marked the «first wave» of trade tensions, beginning in 2018.4 These have led to a first redesign of global value chains. Although we have seen cases of «friendshoring», or the relocation of parts of the value chains to so-called friendly countries (either to avoid tariff costs or to protect against a potential further deterioration of the geopolitical situation), the resulting deviations of trade flows, as well as China’s growing importance and degree of specialisation in global value chains, make it difficult to conclude that the trade links between the US and China have indeed lost importance.
On the other hand, the protectionist shift in the US has not only led to a deterioration of multilateralism (as is evident, for example, with the US blocking appointments to the WTO’s Appellate Body, the main mechanism for resolving trade disputes between countries, since 2017), but it has also driven other countries to change their trade policies. What new geo-economics will the «second wave» of trade tensions bring us?
- 4. See, for example, H. Utar et al. (2023), «The US-China Trade War and the Relocation of Global Value Chains to Mexico», CESifo Working Paper nº 10638. China-US tariff barriers are currently at levels three to six times higher than those observed up until 2018, according to the Peterson Institute for International Economics (PIIE).
Geopolitics
We analyse the major geopolitical trends and how they influence the financial markets and economy.

To read below

Election year in the US

2024: a year of improvement