Which of Portugal’s export sectors can grow the most post-COVID?
In the current context, marked by the breakdown of some supply chains, to what extent can Portugal take advantage of the situation, position itself as an alternative supplier and increase the contribution from exports to GDP growth?
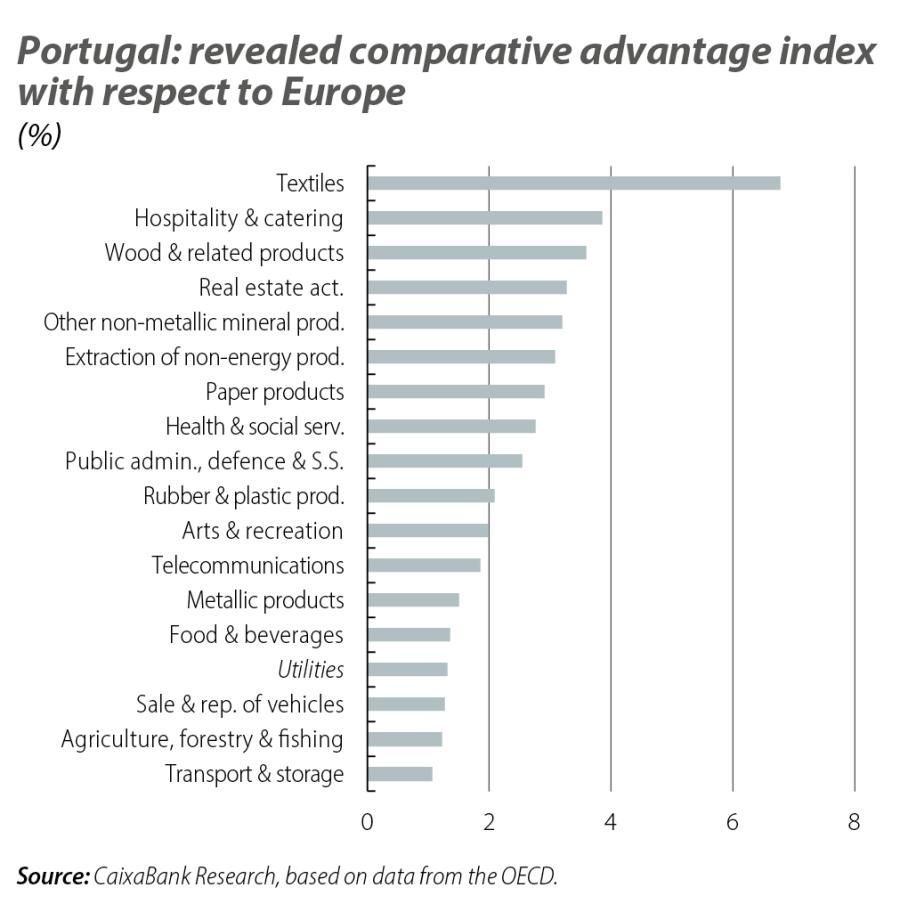
To answer this question, we have calculated the Revealed Comparative Advantage (RCA) index,1 using OECD estimates as a basis for exported domestic value added (DVA).2 This approach shows that, compared to the European market, Portugal has greater relative specialisation in 18 of the 39 sectors that make up the OECD database (22 compared to the rest of the world).
In a scenario marked by disruptions in global supply chains, these sectors could be well positioned to benefit from a potential increase in demand from the country’s trading partners, since there would be an opportunity to replace pre-pandemic suppliers that were forced to halt production. This possibility is particularly important in Europe, where demand for alternative suppliers may be more immediate if we take into account that business activity is reviving more quickly than in other regions around the world.3
The fact that the European market is the destination of 78% of Portugal’s exports of goods suggests that the country is in a privileged position to replace non-European suppliers, being a well-known and reliable partner. Of course, if this were to happen, it would help to boost economic activity and improve the external balance.4
In this context, which represents a growth opportunity for export companies that have comparative advantages in the European market, it is worth noting that the sectors best positioned to correct the supply failures in Europe, thanks to their greater degree of specialisation relative to the European market, account for 70% of the exported DVA and 60% of the economy’s total GVA. If we bear in mind that each euro of export growth translates into a 56-cent increase in GDP,5 the potential increases in foreign demand directed to these sectors could have a significant impact on the economy as a whole.
- 1In summary, the RCA index compares the market share of the exporting sector in a given country against the market share of that same industry in global exports. A value above 1 means that the sector in question has a higher relative specialisation in the country under analysis. The latest year available in the OECD’s Trade in Value Added (TiVA) database, «Origin of value added in gross exports», is 2015.
- 2Data on exported domestic value added allows us to identify the source of the value added which is exported by the sector, regardless of whether the sector itself has exported directly or it has done so indirectly through inputs from other sectors to the exporting sector.
- 3Fiscal Monitor Database of Country Fiscal Measures in Response to the COVID-19 Pandemic (https://www.imf.org/en/Topics/imf-and-covid19/Fiscal-Policies-Database-in-Response-to-COVID-19).
- 4Portugal’s current account balance has improved significantly over the last 10 years, going from an average annual deficit of –8.7% between 1996 and 2011 (with a peak of –11.8% in 2008) to a positive annual surplus of 0.3% between 2012 and 2020. In this latter period, after peaking in 2017, we have witnessed a contraction in the surplus position as a result of the deterioration in the balance of goods deficit, which since 2018 has exceeded 7% of GDP.
- 5According to the National Statistics Institute, each additional euro of exports translates into a 56-cent increase in GDP (54.5 cents in the GVA and 1.5 cents in taxes net of subsidies).
Among these sectors, those with an RCA index greater than 2 represent 33% of the exported DVA and 27% of the economy’s overall GVA. These stand-out sectors include a number of traditional Portuguese industries such as textiles, wood, paper and rubber, but they also include service companies such as those in the real estate, catering and hospitality sectors.
The 10 sectors with an RCA index greater than 2 have a lower average annual growth rate than that of the total exported DVA (3.6% between 2005 and 2015, compared to 3.9%), although there are differences between producers of goods and services. Whereas exports of goods show an average annual growth of 2.8% (with the exception of rubber and plastic producers, with a 6.7% annual growth rate), service activities show an average annual growth of 5.4%. The range of annual growth rates in services ranges from 8.1% in the case of real estate services to 5.6% and 2.3%, respectively, in domestic value added exports in the areas of health, and culture and entertainment. These figures reflect a greater buoyancy in service activities than in the case of goods, as well as the efforts made to achieve greater internationalisation.
In short, Portugal has a set of sectors that can benefit from increases in external demand, including traditional sectors producing goods such as textiles, clothing and footwear, wood and paper, and rubber and plastics. However, it can also seize the opportunity to increase the production and sale of goods and services that have been growing at high rates, some of which already have a high relative weight in the exported DVA, as is the case of the transportation and storage sector, as well as others with only a small representation in the exported DVA, such as services related to human health.


