Slow but steady progress in the euro area
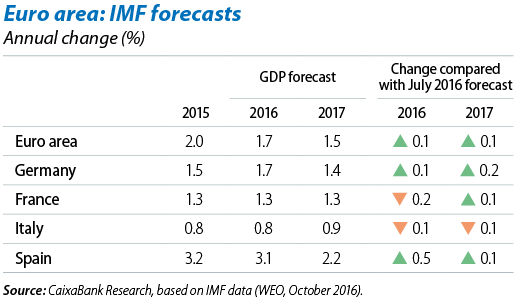
The euro area’s economy keeps on with a sustained recovery. In spite of the episodes of uncertainty observed during the year (financial volatility at the start of 2016 and the Brexit referendum in June), the euro area’s recovery has remained solid. One example of this is that the IMF’s latest forecasts place growth in 2016 at the same figure of 1.7% predicted by the institution at the beginning of the year (slightly higher than the 1.5% forecast by CaixaBank Research), thereby reversing the downward revisions made halfway through the year. However, these forecasts also reflect the absence of acceleration in the recovery in spite of the stimulus provided by the ECB’s monetary policy, which has been particularly expansionary since the beginning of 2015. In fact a slowdown in growth is expected for 2017 (1.5% according to the IMF; 1.3% according to CaixaBank Research) due to the disappearance of some tailwinds (rising oil prices and stabilisation of the euro) and political uncertainty (UK-EU negotiations, voting in Italy, Austria, the Netherlands, France and Germany).
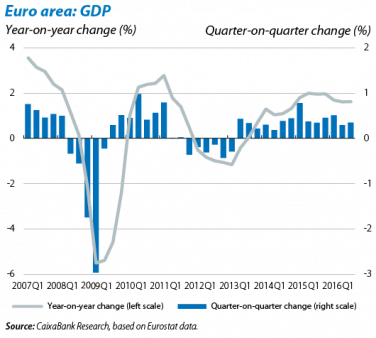
The euro area’s GDP for Q3 was slightly higher than expected, up by 0.3% quarter-on-quarter and by 1.6% year-on-year, the same figures as in the previous quarter. By country, the figures for Spain (0.7% quarter-on-quarter) and France (0.2%) have been published. The composition of the growth in this last figure shows that consumption by French households continued at a standstill in Q3 (0.0% quarter-on-quarter for the second month in a row) while growth in investment returned to positive terrain (0.3%). This combination of good and bad points in the situation of the French economy has therefore failed to dispel doubts regarding France’s economic recovery. The figures for the UK were notable, however, with 0.5% quarter-on-quarter growth which surprised the consensus of analysts (predicting 0.3%). Nevertheless, the breakdown by sector shows that only services enjoyed positive growth (0.8% quarter-on-quarter) while production fell in agriculture, industry and construction, indicating that the British economy will continue to slow down as a consequence of Brexit.
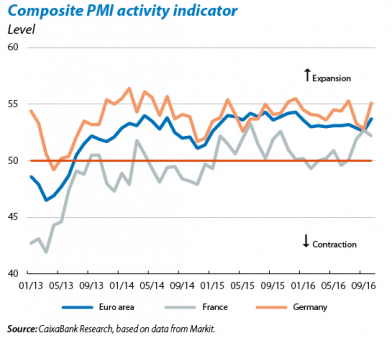
Business indicators point to a moderate growth rate. Both the initial indicators available for 2016 Q4 and those still being published for 2016 Q3 point to the recovery in the euro area continuing steadily. Industrial production picked up in August by 0.8% (average year-on-year change for the last three months), approaching the average for 2016 Q2 (0.9%). Moreover, the PMI remains comfortably in the area in line with economic expansion (above 50 points) and rose to 53.7 points in October, offsetting the slight drop experienced after the outcome of the Brexit referendum. Lastly, and along the same lines, the economic sentiment index (ESI) of the euro area reached an annual peak, standing at 106.3 points in October (+1.4 points compared with September). By country, the indicators highlight Germany’s drive, with industrial production recovering in August (0.5%) and significant improvement both in the PMI (up to 55.1 points in October, the best figure all year) and in the ESI (108.7 points in October, the highest for 2016).
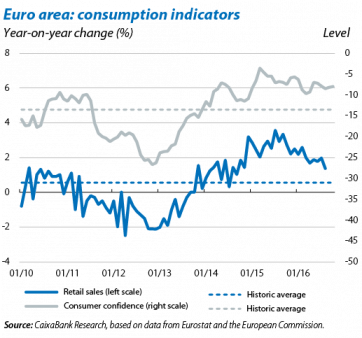
Domestic demand continues to boost the recovery. The initial figures for 2016 Q4 point to household consumption continuing to perform well. Specifically, the consumer confidence index for the euro area looked stable in October at –8.0 points, slightly better than the average of –8.2 for Q3. The indicators being published for Q3 also suggest private consumption has played an important role in activity’s growth. In particular, retail sales rose by 1.5% year-on-year on average in the months of July and August, a similar figure to the one in Q2, continuing to place private consumption as one of the mainstays for the euro area’s recovery.
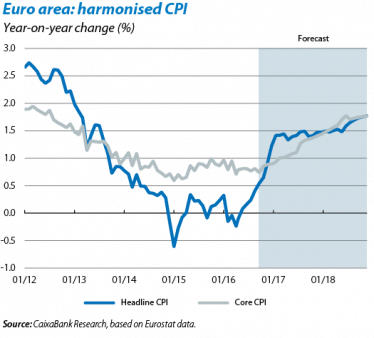
The upswing in inflation occurs as predicted. The harmonised index of consumer prices (HICP) for October states that headline inflation for the euro area rose to 0.5%, 0.1 pps above September’s figure, while core inflation slowed down slightly to 0.7%, 0.1 pps below the previous figure. This growth in headline inflation is due to a smaller decline in the energy component and, in this respect, we expect to go on seeing a sustained recovery over the next few months, with the base effect of the slump in oil prices in 2014 and 2015 gradually fading. Core inflation will also rise steadily thanks to growth in activity.
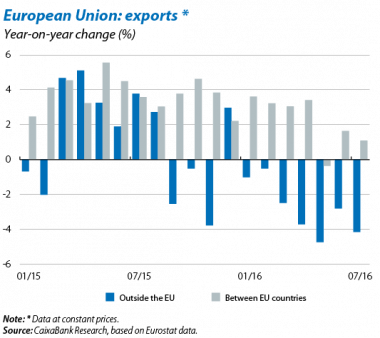
The recovery is consolidating within an unfavourable external environment. The latest data available, from July 2016, show the EU’s domestic demand to be boosting exports to different European countries, countering the drop in foreign demand, with the figures suggesting that exports to outside the EU have shrunk in real terms since September 2015. However, in the last two years intra-European exports have continued to expand steadily (with the exception of May 2016), boosted by the upswing in domestic demand. This strong domestic recovery has therefore helped to offset the impact of the slowdown in the emerging economies in 2016.
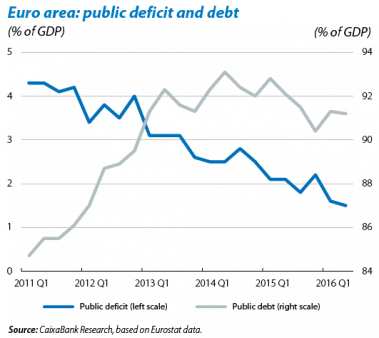
The level of public debt remains high. In spite of an ongoing reduction in public deficit, down by 1.5% of GDP in 2016 Q2 for the euro area as a whole, the debt of member states has remained stable and above 90% of GDP. Specifically, in 2016 Q2 public debt represented 91.2% of GDP in the euro area as a whole, practically the same level as in 2015 Q3 (91.5%). This stability, however, obscures disparate situations in different countries. On the one hand, public debt is falling more quickly in those countries with a lower level of debt in 2015, such as Germany (70.1% in 2016 Q2, –2.5 pps compared with 2015 Q2), Ireland (77.8% in 2016 Q2, –13 pps compared with 2015 Q2) and the Netherlands (63.7 pps in 2016 Q2, –3.3 pps compared with 2015 Q2). On the other hand, in another group of countries debt has remained stable or even increased (Belgium, Spain, France, Italy, Austria and Portugal). Given that this second group has higher levels of public debt, it is important for them to start reducing this figure to more sustainable levels. Moreover, in a context in which most of the weight of stimuli falls disproportionately on monetary policy, it is also important for those countries enjoying some fiscal margin to take advantage of this to boost growth and strike a better balance between monetary and fiscal policy.
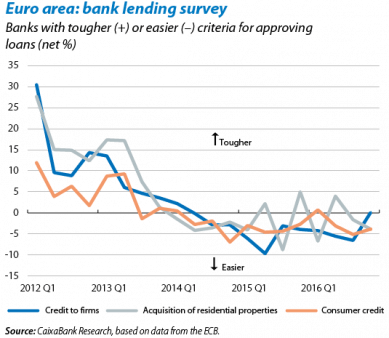
Financial conditions are highly accommodative, supporting the recovery in domestic demand. The ECB’s bank lending survey shows that, in Q3, households had easier access to loans for consumption and to purchase housing while companies continued to benefit from the easier conditions achieved in previous quarters. The survey indicates that this relaxation in criteria to grant loans is largely due to competitive pressure in the banking sector. These pressures are taking place in an environment of negative interest rates that is squeezing the industry’s margins and, in turn, is making the ECB’s expansionary monetary policy less effective. To lessen some of the responsibility that falls to monetary policy for stimulating the economy, it is important not to ease off with the process of structural reforms and to design fiscal policy with a view to boosting growth.
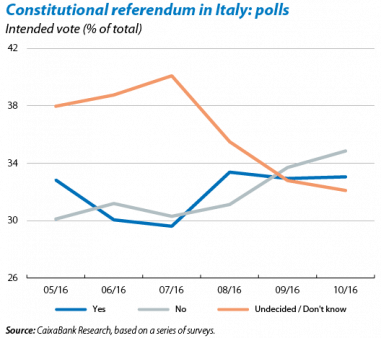
Political uncertainty adds to weak growth in Italy. Italy’s growth forecasts are 0.9% for 2016 and 0.8% for 2017 but the absence of any comprehensive strategy to resolve its banking problems (with a high non-performing loan ratio) makes this a significant source of instability. Moreover, on 4 December a referendum will be held on Italy’s constitutional reform which aims to make the legislative process more agile. The large number of undecided voters indicated by the polls (more than 30%) is keeping uncertainty high regarding the outcome and a clear «no» victory could jeopardise the country’s political stability and its reformist drive.
