Is Spain importing as much as it used to?
Spain has been accumulating a trade surplus of goods and services since the beginning of 2012, which is helping to reduce the high deficit in net international investment. But this has not always been the case. Before the 2008 financial crisis, Spain was accumulating trade deficits year after year. Since the crisis, the weakness in domestic demand, which meant fewer imports, and the increase in competitiveness, which facilitated the increase in exports, led to a rapid improvement in the balance of trade in goods and services. In November 2013, it reached a surplus of 3.3% of GDP, the highest since the beginning of the series in 1995. Unlike past recoveries, the balance of goods and services has remained in surplus despite a recovery in domestic demand and the logical recovery of imports, although the surplus has reduced to 2.6% (May 2018).
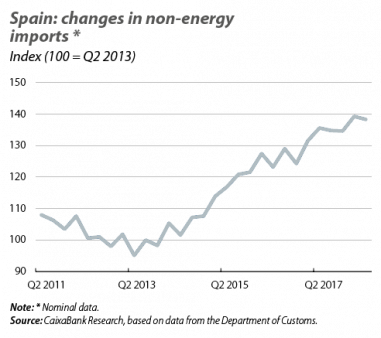
In the medium term, however, there are doubts as to whether the good rate of exports can continue to offset the growth of imports, which has been particularly strong since 2015. Specifically, in 2013 and 2014, imports of goods and services grew at an annualised rate of 5.8%, but between 2015 and 2017 the rate of growth has accelerated to 6.9%.1 To what extent is this increase in the rate of imports cause for concern? On the one hand, imports undermine the trade surplus and may reflect a competitive deficit which forces the country to buy abroad. However, this change could also be the result of greater integration of the Spanish economy into global supply chains: Spanish companies buy competitive products from abroad at low prices and, in turn, they integrate these products into new products for export.
In order to assess the relative weight of each argument, we can look at the import intensity of the Spanish economy, that is, the level of imports needed in order to reach a certain level of economic activity.2 Imports can grow either because of a composition effect, through which the components of demand that are linked with greater import intensity account for a larger portion of total demand, or alternatively because the import intensity of each component increases, which would be more worrying. The first factor – the composition effect – has contributed to higher growth in imports, since the gross capital formation and exports, which have a higher import intensity than public and private consumption, are precisely the components of demand that have grown the most since the start of the recovery (from June 2013 to March 2018, nominal GDP grew by 16.3%, compared to a growth of 33.9% and of 22.7% in gross fixed capital formation and in exports, respectively).
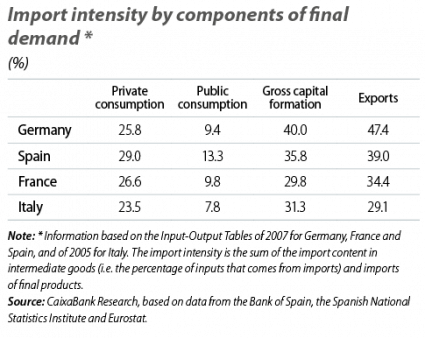
With regards to the second factor, unfortunately we do not have any time series of the import intensity of the various components of demand, as the most recent data available correspond to the estimated import intensity for 2007.3 Back then, the picture was not very flattering: component by component, Spain had an import intensity higher than France and Germany. How have things changed since then?
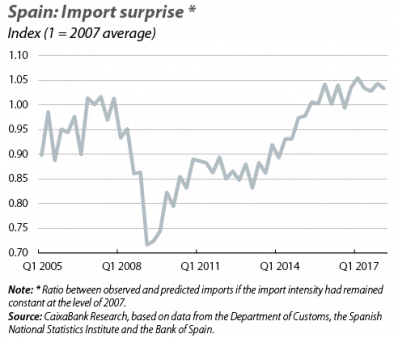
To answer this question, we can estimate whether the growth of imports has been higher or lower than would be expected if the import intensity of the various components had remained constant. To this end, we built an «import surprise» indicator.4 According to this indicator, an import surprise of 1 would indicate that, on average, the import intensity ratios of 2007 remain in place. An import surprise above 1, meanwhile, indicates that the import intensity of the various components of demand has risen on average. Finally, an import surprise of less than 1 indicates that the import intensity has fallen.
The trend in the import surprise over time shows four distinct phases. Firstly, we have a pre-crisis period (2005-2008) characterised by stability, with values close to 1, meaning that the ratios of 2007 dominated. This was followed by the hiatus of the financial crisis, which saw a paralysis of trade. This brought about a sudden drop in imports and, as a consequence, a decrease in the import surprise (imports fell more than would have been expected based on the contraction of economic activity). The third phase is the first phase of recovery, between 2013 and 2014, where the import surprise temporarily stabilises at values below 1, meaning that, on average, the import intensity is lower than it was during the pre-crisis period. The fourth phase begins in 2015 and is the second phase of recovery, characterised by a rapid rebound of the import surprise to the values seen prior to the financial crisis, close to 1.
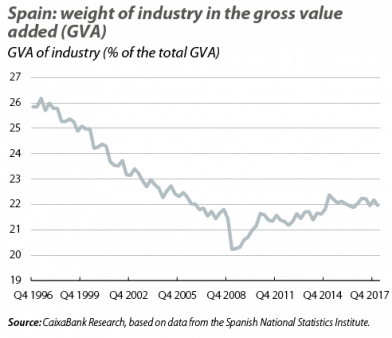
What can we conclude from these trends in the import intensity? The lower import intensity of the first phase of the recovery could be attributed to the Spanish economy’s increased competitiveness, with a higher preference for domestic goods and services over foreign ones. Seen in this way, the recovery of the import intensity to pre-crisis values would be a negative trend. However, we should remember that the positive performance of exports has made it possible to maintain the trade surplus despite the boom in imports, which indicates that exports are maintaining their competitiveness. In fact, we will conclude by pointing out three factors that can explain why the recovery of the import intensity does not point to a loss of competitiveness. The first is the differing cyclical sensitivity of the sub-components that make up the consumption, investment and exports. Thus, the recent increase in the import intensity could reflect the fact that, due to their sensitivity to the business cycle, the sub-components that have a higher import intensity (such as durable goods, within private consumption) are starting to grow more.5 The second factor is integration: it could be the case that the growth of imports is due to Spanish companies becoming more integrated into global supply chains, as a result of increased competitiveness and the recovery of supply chains that were broken during the financial crisis.6 The third factor is the pause in the trend of the Spanish economy moving towards tertiary sectors, which has been taking place since the 1990s. In this regard, since 2013, the weight of industry in the total gross value added of the economy as a whole has stopped declining, supposedly supported by the increased competitiveness which has helped to boost exports of goods. Given that industry has a higher import content than services,7 this could also contribute to the greater import intensity observed in the economy as a whole.8
1. Excludes energy imports, which are closely linked to the volatility of oil prices.
2. More specifically, import intensity is the sum of the import content in intermediate goods (i.e. the percentage of inputs that comes from imports) and imports of final products.
3. Bank of Spain (2012), «The import content of the branches of economic activity in Spain», Economic Bulletin.
4. Specifically, we calculate the ratio between the nominal observed imports of goods and services (excluding energy) and the imports predicted by the import intensity of the various components of demand estimated in 2007 and the observed growth of these components. The indicator is normalised so that a value of 1 represents the average for 2007.
5. To validate this hypothesis, we would need information on the import intensity of the various components of demand at a more disaggregated level that would allow us to distinguish, for instance, between the consumption of durable and non-durable goods.
6. Reaching a clearer conclusion on this matter would require a more granular analysis by economic sector, identifying the branches of industry with a high and medium-high technological content, as well as a comparison with France and Germany.
7. The industrial sector has the highest import content of all sectors, at 38.2%. See the Focus «Towards a less import-dependent production model» of the MR10/2015.
8. Here we would need to look at the change in import intensity over time of the different branches of services, which in recent years have made a positive contribution to the trade surplus, compared with industry.


