Which groups are suffering the most as a result of the COVID-19 economic crisis?
CaixaBank’s internal data allow us to assess in detail which groups are particularly suffering as a result of the crisis generated by the COVID-19 pandemic and to what extent public sector transfers are proving effective in protecting them.
The economic crisis is not affecting all groups alike. As we have seen in the previous article, people who had lower incomes before the crisis have generally been more disadvantaged. In addition, the impact of the crisis may be different depending on other socio-economic characteristics such as age, gender, or place of origin or residence. CaixaBank’s internal data allow us to assess in detail whether any of these groups are particularly suffering as a result of the crisis generated by the COVID-19 pandemic and to what extent public sector transfers are proving effective in protecting them.
Income distribution by age group
Age is undoubtedly one of the dimensions in which the differences between the various population groups are most accentuated. As can be seen in the Sankey diagrams below, young people between the ages of 16 and 29 had a clearly lower income level from the outset than that of older people, and they are also experiencing the biggest deterioration: between February and April, before taking public sector transfers into account, the relative weight of the group of young people with no income increased by 24 pps, compared to the 15-pp increase we saw in the population as a whole. In addition, young people who had lower incomes before the pandemic are among the groups who are suffering the most from the crisis. Specifically, 42% of young people who had middle incomes before the pandemic ended up with a low income or no income at all, while of those who had a low income, 44% ended up with none. When we analyse these trends for the population as a whole, while the impact is still very significant, it is 10 pps lower than it is among the young.1
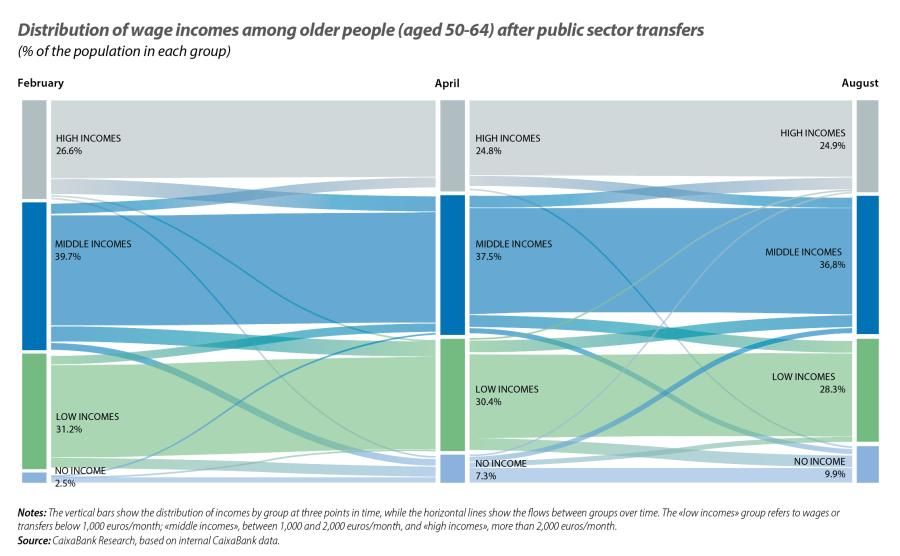
Among older people in the 50-64 age bracket, the impact was less pronounced, albeit nonetheless notable. Specifically, the number of older people with no income increased by 9 pps, while the percentage of older people who had a low income before the pandemic and who were left without any income in April (before taking public transfers into account) was 23%. This is 10 pps lower than for the population as a whole and 22 pps lower than the figure for young people. At the other end of the income distribution, in contrast, the number of people with high incomes remained more stable over time, both among older people and among young people.
The diagrams also show how public sector transfers cushioned the impact of the crisis on both groups. The level of coverage they offer to young and older people is similar, around 50% in both cases. Specifically, when we consider incomes including public sector transfers, the increase in the number of people with no income is halved (11.8 pps in the case of young people and 4.8 pps among older people). Finally, it can also be seen how the economic revival that took place from May helped to undo some of the initial impact, especially among the young, although their economic situation has by no means returned to pre-crisis levels.2
The trends in the Gini index by age group also reflect the fact that the crisis is having a different impact between different groups. Among the young, the Gini index before public sector transfers rose by 19 points between February and April, while in August it was still 8 points above its pre-crisis level. In contrast, among older people the increase was clearly lower, and in August it was «only» 3 points above the level of February. When we look at the Gini index after public sector transfers, although these differences between young and older people are less pronounced, they nevertheless persist: among the young, in August the index stood 6 points above the pre-crisis level, while among older people it increased by 1 point.
- 1The differential impact of the crisis by age can also be seen in unemployment. The youth unemployment rate (among 16-29 year olds) increased to 30.0% in Q2 2020 (+6.2 pps compared to Q4 2019), whereas for the population as a whole it reached 15.3% (+1.5 pps compared to Q4 2019).
- 2For instance, the proportion of people with no income (before taking public transfers into account) has declined. It should be noted that the Sankey diagrams are not corrected for seasonal variations and in August there is a seasonal increase in the number of people with no income, which is more pronounced in the case of young people.


Income distribution by origin
The crisis is also having a very different impact depending on people’s place of origin, being more pronounced among those born outside Spain. As in the case of young people, immigrants present an income distribution that is skewed towards lower incomes, which are suffering the most during the crisis. Excluding public sector transfers, between April and February 46% of those born outside Spain and who, before the pandemic, had middle incomes suffered a shift down to low incomes or ended up with no income at all. As for those with low incomes, 36% ended up with no income. Thus, the number of people with no income who were born outside Spain increased by 21 pps between February and April. In August, an increase of 14 pps from pre-pandemic levels still persisted. It is worth noting that, if we take into account the role of the public sector, the increase in the number of people who ended up with no income is significantly lower, although it is still very high (an increase of 10.2 pps between February and April). Therefore, the implicit level of coverage is very similar to that of the population as a whole. As was the case with young people, the Gini index also shows a more pronounced impact of the crisis for this group, with an 8-point increase in August compared to pre-crisis levels before taking public transfers into account, and a 4-point increase after including them.
Income distribution by gender and place of residence
When we analyse the impact of the crisis according to gender, we see some differences between women and men, although they are much smaller than those discussed earlier in relation to age or country of birth. As an example, before public sector transfers, the proportion of women with no income increased by 15.7 pps between February and April, while for men the increase was of 14.2 pps (7.4 pps and 6.5 pps when public transfers are taken into account, respectively). The increase in the Gini index is also similar in the two groups. Between February and April, and before taking public sector transfers into account, the index increased by 12 points for women and by 11 for men, while in August the increase versus pre-pandemic levels was of 5 points in both cases (2 points for women and 3 for men when including public transfers).
Analysing the impact of the crisis by place of residence also reveals interesting differences. If we divide the territory according to population density, we see that the crisis is having a somewhat more pronounced impact in urban areas than in rural areas.3 For instance, in urban areas the proportion of people who were left with no income was 16 pps between February and April, while in rural areas it was 12 pps. The increase in the Gini index was also different depending on the area. As can be seen in the chart, the increase in inequality between February and April was clearly greater in provinces with a higher proportion of urban population. Nevertheless, it should be noted that regional differences almost disappear when we take public sector transfers into account: there is no longer any relationship between the percentage of population in urban or rural areas and the final change in the Gini index.
- 3We take Act 45/2007 on the sustainable development of the rural environment as a benchmark, defining a municipality as rural if its population is less than 30,000 inhabitants and its population density is less than 100 inhabitants per km². All other municipalities are defined as urban.

Analysing the regional impact of the pandemic reveals a similar pattern, with some autonomous communities, such as the Balearic Islands and Canary Islands, being much more heavily affected than others before taking public sector transfers into account. However, once we incorporate public transfers into the analysis, the differences are significantly reduced.
Inequality & inclusive growth
We analyze the causes and consequences of inequality and what policies can foster inclusive economic growth that is distributed equitably in society.

Real-Time Economics
Follow the evolution of the Spanish economy with our real-time indicators and our published articles.