Why has public consumption grown so much in recent years?
Expenditure on final consumption by Spain’s public administrations has grown significantly in recent years. In this article, we analyse the recent dynamics in public consumption, after first shedding some light on what this concept entails.

The final consumption expenditure of the general government, or public consumption hereon in, has experienced significant growth in recent years. As shown in the first chart, it went from accounting for 18.7% of GDP, on average between 2015 and 2019, to 21.7% in 2020, the year of the COVID-19 pandemic. This sharp increase is explained by the government support measured introduced that year, as well as by the collapse in GDP. Since 2021, the percentage has steadily moderated thanks to the strong recovery of GDP in the period, but in 2024 it stood at 19.4%, still 0.7 pps above the pre-pandemic figure. Before embarking on an analysis of the recent dynamics in public consumption, let’s clarify what lies behind this concept.

What is public consumption?
Public consumption is the value of all the goods and services destined for consumption, which the general government provides to households. It includes goods and services produced by the government itself, as well as those it acquires in the market, such as education, health, culture and defence.1 Since the production of these goods and services is supplied to households free of charge, or at below-market prices, this production is usually valued by taking the sum of the production costs, which includes wage-earners’ remuneration and intermediate consumption, among other items.
It is important to note that public consumption is not equivalent to public spending. There are items of public spending that do not fall within the definition of public consumption and vice versa. For instance, payments made by the public sector to households, such as pension spending, unemployment benefits or interest payments on public debt do not fall within the perimeter of public consumption. Public investment is also excluded, given that it is not consumption, as are various other items. On the other hand, expenditure on consumption of fixed capital, which represents the depreciation of the general government’s fixed assets and constitutes a production cost (since it is an accounting concept that does not involve the disbursement of funds), is included within public consumption, but not within public spending.2
How has public consumption evolved recently?
The second chart shows the annual change in nominal public consumption since 2014, as well as the contribution of each of its components to its growth. There are several points worth highlighting. Firstly, public consumption continued to grow in 2020, despite nominal GDP plummeting by 9.9% that same year. This explains the sharp rise in public consumption as a percentage of GDP that year, as discussed at the beginning of the article.
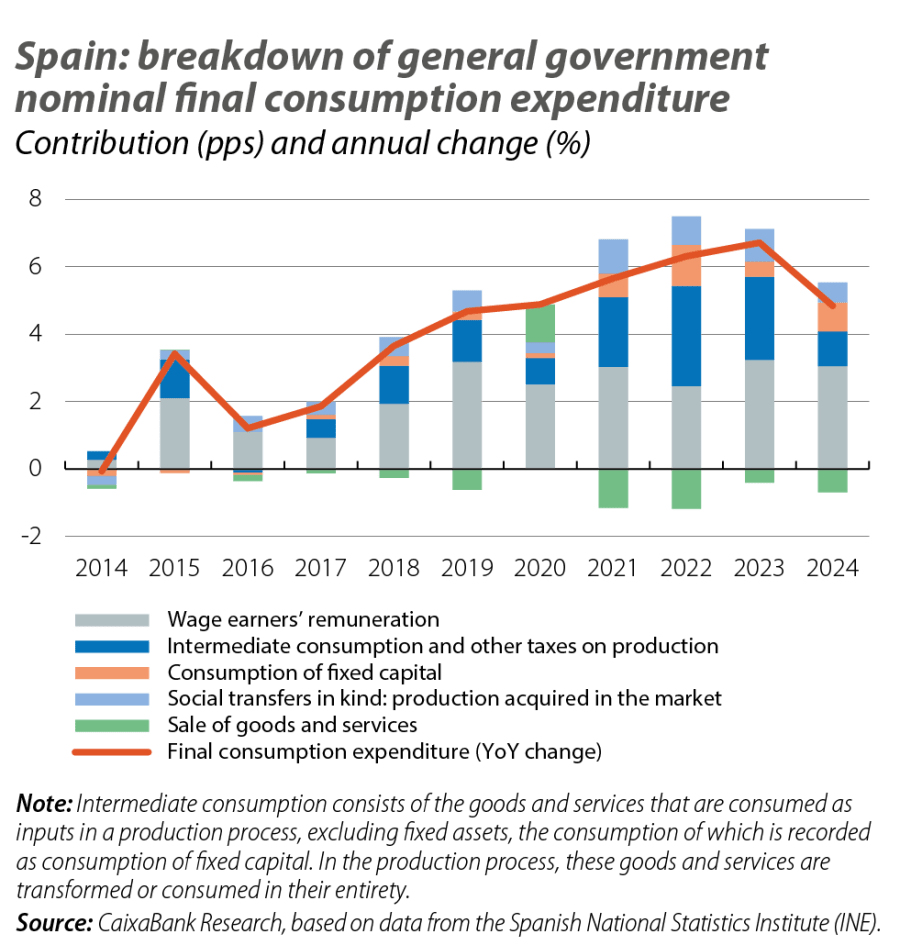
Secondly, we can see how between 2021 and 2023 the acceleration in the growth of public consumption is mainly explained by the greater contribution of intermediate consumption.3 Specifically, whereas the average contribution of intermediate consumption to the annual growth of public consumption between 2015 and 2019 was 0.8 pps, between 2021 and 2023 it was 2.5 pps. We can also see how the contribution of wage earners’ remuneration has remained fairly stable throughout the period between 2021 and 2024 relative to 2019. Finally, in 2024 we see a substantial moderation in the growth of public consumption due to a normalisation of the contribution from intermediate consumption.
In order to dig a little deeper into what lies behind this higher growth in intermediate consumption, we must turn to the so-called Classification of the Functions of Government (COFOG). This classification breaks down public expenditure into 10 functional categories and allows us to track where the expenditure is being allocated.4,5 In this way, we can see the destination of intermediate consumption expenditure.
In the third chart, we show the contribution of each of the 10 COFOG categories to the growth of intermediate consumption expenditure during the period 2015-2019 and during the period 2019-2023.6,7 If a point lies above the 45-degree line (in red), it means that that category’s contribution to the growth of intermediate consumption expenditure in the period 2019-2023 was higher than it was in 2015-2019.
- 3In the interests of brevity, we have combined intermediate consumption with other taxes on production, but the contribution of the taxes on production category is small and can be ignored.
- 4The 10 categories are as follows: General Public Services, Defence, Public Order and Security, Economic Affairs, Environmental Protection, Housing and Community Services, Health, Leisure, Culture and Religion, Education and Social Protection.
- 5The COFOG classification also allows the 10 functional categories of expenditure to be broken down into a greater level of detail.
- 6We analyse the period up until 2023 as this is the latest available data.
- 7We focus on the contributions, rather than percentage changes, to avoid confusion given that there are items with very small quantities that can show very high percentage changes in the event of only small changes in expenditure in absolute terms.

The chart reveals that all categories made a bigger contribution to this growth between 2019 and 2023 than they did in the period from 2015 to 2019. This comes as no surprise, given that the cumulative growth in intermediate consumption expenditure between 2019 and 2023 was much higher than in 2015-2019, standing at 33.2% compared to 10.4%, respectively (22.8 points higher).
It is thus more interesting to look at how far away each category lies from the 45-degree line. This distance tells us how much more this category has contributed in the period 2019-2023 compared to 2015-2019. According to this metric, there are three categories that stand out, in order of importance: Health, General Public Services and Economic Affairs. In other words, while in 2019-2023 intermediate consumption expenditure grew 22.8 pps more than it did in 2015-2019, of these 22.8 pps, 13.2 pps (almost 60%) is attributable to these three categories.
The COFOG classification also reveals a greater level of detail within each of the 10 categories, which allows us to interpret that, in all likelihood, both the pandemic and the interest rate hikes of 2022 and 2023 explain part of the increases in expenditure. Thus, the higher growth noted within the Health category is due to higher spending on the components of Hospital Services, Outpatient Services and Public Health Services. These categories include the cost of services offered to patients in outpatient clinics and hospitals, as well as the cost of the products used to provide these services, such as the cost of the medicines supplied or that of medical equipment. In this regard, we can see that after the pandemic the increase in health spending has been consolidated.
Within the General Public Services category, the component of Public Debt Transactions stands out, indirectly affected by the rise in interest rates, as does the General Services component, to a lesser extent.88 General Services includes services that are not attached to a specific function and are typically performed in administrative offices of the various branches of government. Finally, within the category of Economic Affairs, Transport stands out and, to a lesser extent, so does Agriculture, Forestry, Fishing and Hunting, and Other Activities.9
- 8Interest payments are not part of public consumption, but the category of Public Debt Transactions does include Financial Intermediation Services Indirectly Measured (FISIM) within intermediate consumption expenditure.
- 9Transport category includes all management, construction and maintenance of transport systems, whether road (motorways, roads, etc.), rail, sea or air (including airport management), in addition to the regulation and supervision of these systems.
Conclusions
The growth of public consumption in recent years has been mostly driven by the increase in intermediate consumption, especially in the areas of Health, General Public Services and Economic Affairs. This increase reflects both the consolidation of higher health spending after the pandemic and the rise in interest rates. As the pressure on these components, especially that linked to interest rates, fade over the coming quarters, we expect the growth rate of public consumption to continue the gradual moderation that has already begun in 2024.