
Europe needs to channel its high savings into productive investments
In Europe, a significant portion of household wealth remains concentrated in housing and deposits, whereas in the US, the greater presence of investments in stocks and funds reflects the existence of deeper, more liquid and developed capital markets.

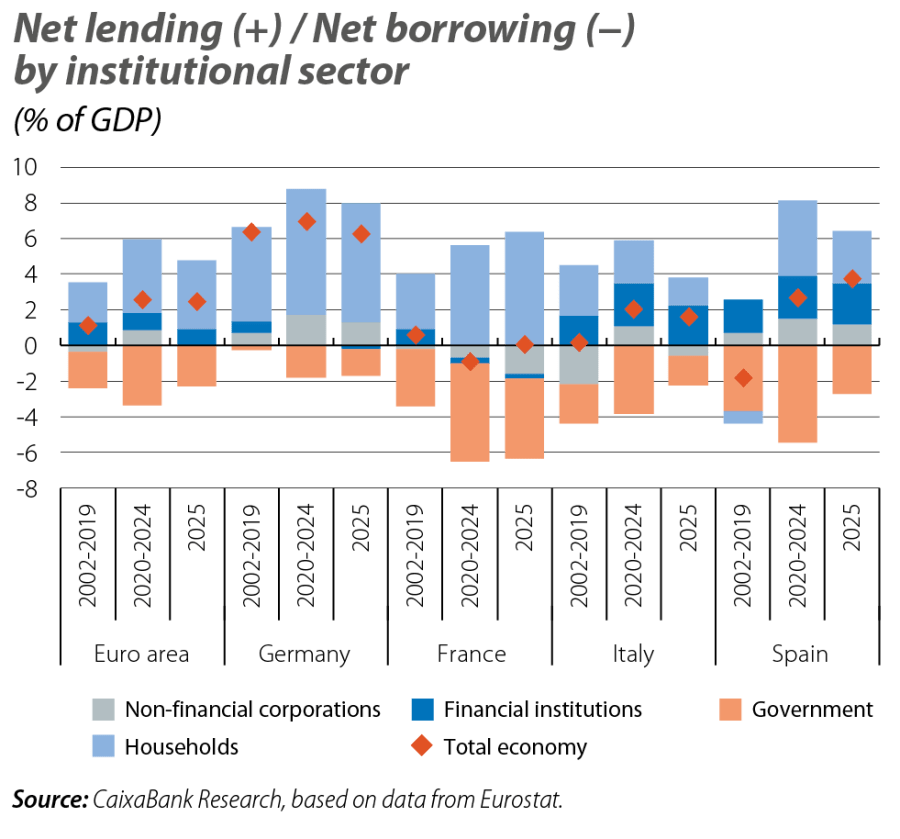
The euro area has maintained a high lending capacity, even during major shocks, largely driven by households.1,2 By country, Germany has been the major source of lending, regardless of its position in the cycle. Spain and Italy’s lending capacity, meanwhile, has been more heavily affected by the euro crisis, the pandemic, and the energy crisis triggered by the war in Ukraine. This behaviour reflects significant structural differences and is consistent with the diagnosis outlined in the Draghi report3 and the European Commission’s «Spring Package»:4 the region has resources but needs to mobilise them more effectively towards productive investments that enhance competitiveness, strategic autonomy, and the ability to adapt to the new technological, energy and geopolitical reality.
- 1
Lending capacity = gross saving – gross investment.
- 2
Gross saving is the portion of gross national disposable income (GNDI) that is not allocated to final consumption. It is the sum of savings from different institutional sectors (households, businesses and government).
- 3
See «Draghi proposes a European industrial policy as a driving force to address the challenges of the coming decades» in the MR10/2024.
- 4
See the Focus «The upcoming budget takes over from NGEU in the European Semester», in this same report.
Europe’s problem is not a lack of resources for investment
Before the 2008 financial crisis, the euro area’s gross saving stood at around 22% of GDP. Then, after falling to around 20% in 2009-2010, it gradually recovered from 2013 onwards, supported by an improvement in public saving and the recovery of economic activity. In 2019, the gross saving of the economy as a whole stood at around 25% of GDP. The pandemic temporarily changed the composition of savings: household savings reached historic highs, at around 13% of GDP in 2020, compared with an average of 8.0% in the previous decade, offsetting the significant deterioration in the general government balance. Although a part of those savings has been used up as economic activity has returned to normal, household savings still exceed their pre-pandemic average. As a result, gross savings in the euro area reached almost 24% of GDP in 2025, equivalent to some 3.8 trillion euros.
However, this volume of resources has not resulted in an equivalent recovery of investment. After reaching an average of 22.3% of GDP between 2002 and 2008 due to the boom in residential investment, gross non-financial investment fell to a low of 19% of GDP in 2014, in the aftermath of the financial crisis. Subsequently, the low interest rate environment allowed for a slight recovery, but the pandemic, increased uncertainty, and the tightening of financial conditions due to the energy crisis triggered by the war in Ukraine limited its progress. In 2025, investment stood at 20% of GDP, approximately 3.4 trillion euros. This gap between saving and investment translates into a net lending position in the euro area of around 391 billion euros, or 2.5% of GDP. The issue is not the lack of savings, but rather their insufficient conversion into investment within the region itself.
Germany accounts for a significant portion of the euro area’s excess savings
The German economy accounts for about one-third of the region’s gross savings, amounting to some 1.19 trillion euros in 2025, of which more than 47% is household savings. However, the investment effort of the economy has been relatively low: in 2025, gross investment was around 908 billion euros, or 20% of GDP, compared to 21.4% in the euro area. This explains why Germany recorded a lending capacity of nearly 282 billion euros, or around 6% of its GDP, which represents the bulk of the euro area’s aggregate lending capacity.
The gap between savings and investment in Germany is expected to gradually narrow with the implementation of the infrastructure investment plan, although this convergence will be slow. With the exception of Spain, the bloc’s other major economies have a more limited lending capacity. France’s savings have been well below its level of investment since the pandemic, influenced by the deterioration of public saving and the funding needs of the business sector.5 Spain, on the other hand, has shown a notable improvement in household savings since the pandemic. Together with consolidation efforts in the public sector, this allowed it to record a lending capacity of 3.7% of GDP in 2025, which is approximately 63 billion euros.
- 5
Since Eurostat does not publish data on dividend distributions for all countries, we use gross operating profit as a proxy for the income generated by companies. The difference between that profit and the gross savings of companies indicates that in France, the decline in corporate savings is not due to a deterioration in margins, but rather to increased financial cost pressures and/or a more generous dividend distribution policy compared to its partners.
Household savings are allocated to illiquid assets
Households are the main source of savings generated in the euro area, but they have always shown a «more conservative» profile when it comes to investing those savings. Housing constitutes their main asset: it accounts for more than 55% of their total net wealth, over 50% of wealth in the bottom 50%, and 45% in the highest decile. There is also a significant preference for deposits, which account for around 14% of total wealth, over 40% for households in the bottom 50%, but just 10% in the top decile. In contrast, exposure to financial assets with higher expected returns (investment funds and shares) accounts for only 9% of the wealth of all households and is mainly concentrated in the highest wealth percentile, while among the bottom 50% it represents just 3% of their wealth.6,7
In the US, holding financial assets is a more widespread practice. In fact, for households as a whole, housing accounts for less than 20% of their wealth, and deposits make up just 8% of their assets. Corporate shares and investment funds, meanwhile, account for over 30% of their wealth.8There are significant differences between wealth brackets, but even among the groups with less wealth there is a clear preference for somewhat more complex financial products. In fact, for households in the bottom 50%, equities and investment funds account for 14% of their total wealth (well below the more than 50% among wealthier households), while deposits make up between 15% and 20%. As for housing, it accounts for around 30%-40% of wealth among less wealthy households, and only represents between 8% and 13% of the wealthiest households’ wealth.9
- 6
See «Whoever has a home has a treasure» in the MR05/2024.
- 7
In its Household Finance and Consumption Survey (HFCS), the ECB publishes information for each of the 6th, 7th, 8th, 9th and 10th deciles and for the bottom 50%. Deciles divide the wealth series, ordered from lowest to highest, into 10 equal parts and make it possible to differentiate the population by level of wealth. Thus, the lowest deciles represent the population with the least wealth, while the 10th decile represents the wealthiest group.
- 8
Corporate shares encompass shares of both domestic and foreign companies, whether listed or not, valued at market prices, as well as direct investments in companies, not just stock market shares. Investment funds refer to equity funds, mixed funds and fixed-income funds. Among others, this category does not include monetary funds or directly acquired debt securities, which are accounted for in their own categories.
- 9
In its Distributional Financial Accounts, the Fed publishes the distribution of wealth by percentile. It presents five major percentiles: the wealthiest 0.1% (billionaires), the rest of the top 1%, the next 9% (top 10%), then the next 40% (middle and upper-middle class), and the bottom 50%.
Savings in the euro area must be allocated more efficiently
Ultimately, the key issue for Europe is not how much it saves, but how it ensures that these savings fund its future growth. The comparison with the US clearly illustrates this difference: in Europe, a significant portion of household wealth remains concentrated in housing and deposits, whereas in the US, the greater presence of investments in stocks and funds reflects the existence of deeper, more liquid and developed capital markets. This greater depth allows savings to reach companies more quickly and under better conditions, especially those with greater long-term funding needs and higher risk, such as start-ups, innovative companies, or projects linked to the energy and technological transition. This diagnosis aligns with the European Commission’s Spring Package, which proposes advancing the Savings and Investments Union as a necessary vehicle to transform its high lending capacity into higher potential growth, increased innovation, and a better response to geopolitical, technological and climate challenges.