New fiscal package in the US: overheating in sight?
Some people are already warning of the risks of the US economy overheating as a result of the $1.9 trillion stimulus bill, an idea that is beginning to permeate the financial markets, with strong rallies at the long end of the yield curve.
In 2020, the US government approved fiscal aid packages to combat the COVID-19 crisis amounting to 4 trillion dollars (around 20% of GDP). A new package worth 1.9 trillion dollars has also just been approved, in line with President Biden’s initial proposal.
However, in an economy that is experiencing a relatively buoyant recovery, is a 1.9-trillion stimulus too much? It is not just Republican voices, such as in the case of Larry Summers, that are warning about the risks of overheating in the US economy in the face of a package on such a scale.1 Moreover, the idea is beginning to permeate into the financial markets, with marked increases in the long end of the yield curve (see first chart).
- 1See Larry Summers’ article in the Washington Post of 4 February 2021, The Biden stimulus is admirably ambitious. But it brings some big risks, too.
Solid but still incomplete US growth
The economic shock of the COVID-19 crisis in the US has been less intense than in other advanced economies, and its recovery is proving stronger. In Q4 2020, US GDP stood 2.5% below that of Q4 2019, and by mid-2021 it is expected to reach pre-pandemic levels. In contrast, in the euro area, at the end of 2020 GDP was still slightly more than 5% lower than a year earlier and we do not expect it to reach pre-pandemic levels before 2022.
Despite this relative strength in the US, the recovery is still incomplete – even more so than some economic activity indicators would appear to suggest at first glance. For instance, although the US unemployment rate is relatively low at around 6% (compared to the peaks of around 15% registered in the spring of 2020), this rate conceals major weaknesses. One of them is that a vast number of people (some five million) have left the labour market for reasons such as caring for people (especially young children, in the face of the total or partial closure of schools). In this regard, alternative measures of the unemployment rate place it closer to 11%.2
- 2See the Real-Time Population Survey.

New fiscal package: inflationary arguments and nuances
The big question about Biden’s new fiscal stimulus is whether the strength of the recovery that is already underway (though incomplete) really needs support of such magnitude. A simple and quick way to assess this is by looking at the output gap, which measures how far registered GDP is from potential GDP.3 According to the Congressional Budget Office (CBO), the US’ output gap stood at −3% at the end of 2020. This is equivalent to saying that GDP was roughly 650 billion dollars below its potential. In the face of this output gap, the sum of Biden’s new stimulus and the package approved at the end of December (worth 0.9 trillion dollars) amounts to 2.8 trillion – more than four times the size of the gap. Although the amounts implemented in 2021 will be lower, the figures are high enough to highlight the risk of generating inflationary pressures.4
Nevertheless, there are a number of nuances which lead us to believe that the risk of overheating is not as high as the critics of the fiscal package would have us think. Firstly, the output gap is uncertain and difficult to measure. In fact, both the CBO and other institutions that calculate this gap for the US regularly revise their estimates of both future and past values, often making substantial changes. Indeed, some other estimates suggest a much larger gap in the US economy, closer to −6% than −3%.5
Secondly, the extent to which a fiscal stimulus translates into aggregate demand and thus helps to narrow the output gap largely depends on the type of spending that occurs, as well as on the well-known fiscal multipliers associated with different types of spending.6 An increase in health spending to combat the pandemic (with a multiplier clearly greater than 1) is not the same as sending stimulus cheques to citizens (with a multiplier of around 0.5). In this regard, around 40% of the measures included in the new package fit with this second type of proposal (for example, stimulus cheques of 1,400 dollars and extra weekly unemployment benefits). These measures will have less power to drive aggregate demand, since a large portion of these cheques are saved.7
Finally, one of the most compelling arguments in favour of decisive fiscal stimuli is that the risks posed by a package that is too large, while still relevant, pale in comparison to those posed by one that is too small. Janet Yellen, current secretary of the Treasury, herself acknowledges the risks of inflation, but emphasises that the biggest risk right now is not doing enough and leaving the economy «scarred» in the long run.
- 3Potential GDP is the maximum level of output that a country can achieve with the available resources and is compatible with stable inflation around a target rate. See the article «Potential GDP, a key but diffuse concept» in the Dossier of the MR05/2013.
- 4According to CBO estimates, around 70% of the new 1.9-trillion-dollar package will be disbursed in 2021. See https://www.cbo.gov/system/files/2021-03/Recontable.pdf.
- 5See T. Powell, L. Sheiner and D. Wessel (2021). «What is potential GDP, and why is it so controversial right now?». Brookings Series.
- 6For instance, a multiplier of 0.5 means that for every dollar of public spending, 50 cents of output is generated.
- 7In part, the fiscal packages are comparatively larger in the US because unemployment coverage is very low, whereas the European welfare state already automatically plays a stabilising role.
Inflationary risks: just how much are we talking about?
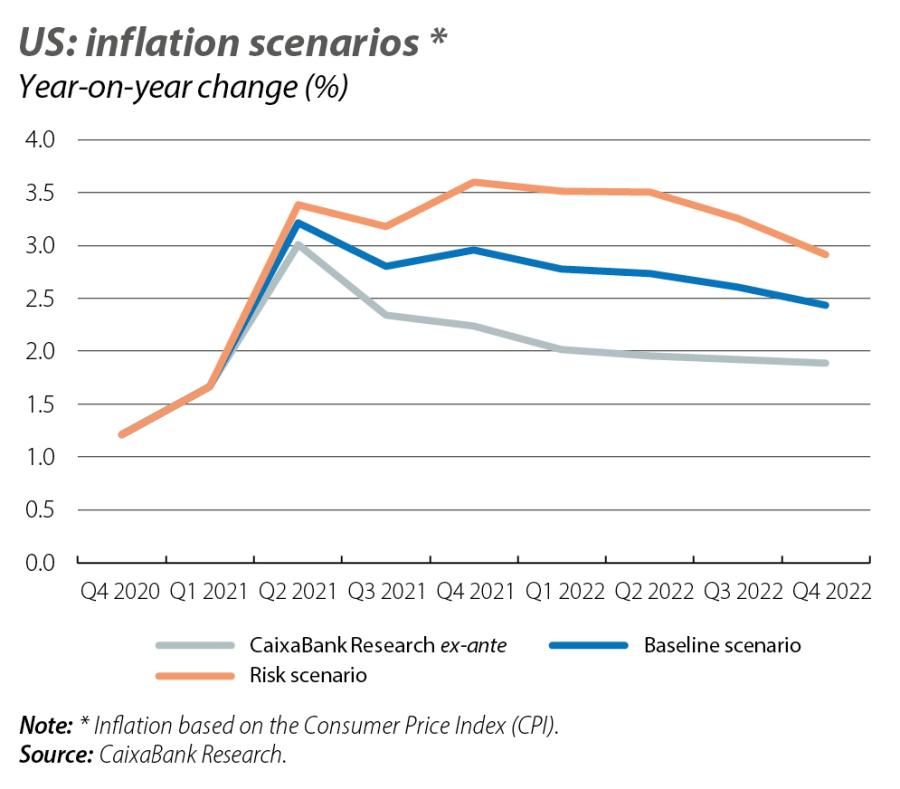
To answer this question, we use the Phillips curve model (which correlates an economy’s inflation to its output gap)8 and propose a scenario in which, with the new fiscal package, the output gap would go from −3% at the end of 2020 (estimated by the CBO) to +2% by the end of 2021 and to +1% by the end of 2022. This is a reasonable scenario based on Sheiner and Edelberg’s projections published in Brookings.9 Due to the high degree of uncertainty in the estimates, we propose a risk scenario (less likely and more extreme) in which the stimulus translates into even greater aggregate demand and the output gap would reach +5% by the end of 2021.10
In the second chart we illustrate the evolution of inflation (based on the consumer price index, or CPI) under the two scenarios and compare them with CaixaBank Research’s forecast prior to news of the substantial 1.9-trillion-dollar package. In all three cases, inflation rises in Q2 2021 to around 3% as a result of base effects.11 However, whereas in the first case (CaixaBank Research ex-ante) the rise in inflation is temporary and rapidly falls back down to around 2%, in the two alternative scenarios inflation remains significantly above 2% through to the end of 2022.12
In particular, in the baseline scenario, CPI inflation is around 2.7% for much of 2021 and 2022. This means that inflation among the components of personal consumption expenditure, which is the Fed’s preferred measure, would be somewhat below 2.5%. This inflation trajectory should not alter the Fed’s roadmap given that, under its new strategy, the monetary institution is willing to temporarily tolerate inflation rates slightly above its target (2%).13
However, in the risk scenario, in which CPI inflation would remain above 3% for longer, the Fed might have to withdraw the stimulus earlier than planned. While we consider this to be a less likely scenario, it exemplifies the shift in the balance of risks towards a scenario with higher inflation which is thus prone to turbulence as financial asset prices adjust to a higher-interest-rate environment.
- 8The Phillips curve formula used is: \(\pi_t\;=\;\rho\pi_{t\;}^e\;+\;(1\;–\;\rho)\pi_{t–1}\;+\;\beta(\gamma_t\;–\;\gamma_n\;)\;+\;\varepsilon_t\) (where \(\pi\;\) is CPI inflation, \(\pi^e\;\) is the long-term inflation expectations, \(\gamma\;–\;\gamma_n\;\) is the output gap, \(\rho\;\) and \(\beta\;\) are parameters and \(\varepsilon\;\) is an error term). We allow the inflation expectations to be endogenous and estimate the system using a linear regression model with time series error. The results are robust to using the PCE price index.
- 9W. Edelberg and L. Sheiner (2021). «The macroeconomic implications of Biden’s $1.9 trillion fiscal package». Brookings.
- 10This is the scenario presented by Blanchard in his recent article in the PIIE (https://www.piie.com/blogs/realtime-economic-issues-watch/defense-concerns-over-19-trillion-relief-plan).
- 11The price index in Q2 2021 will be comparable with the levels reached during the strictest lockdowns (which led to significant declines in several components).
- 12Historically, PCE inflation lies around 3 decimal points below CPI inflation.
- 13For more details on the Fed’s new strategy, see the Focus «The Fed’s new strategy» in the MR10/2020.