The keys to the strong performance of Spanish manufacturing
Between 2019 and 2025, Spain's manufacturing industry has grown at a similar rate to overall GDP, despite the impact of the pandemic and the energy crisis. This strong performance stands in contrast to the stagnation and decline seen in the industrial sector in the main European economies, and marks a departure from the trend of the last two decades, when its share of Spain's GDP fell from 16.7% to 10.8%. In this article we examine some of the drivers behind this turnaround in the Spanish industrial sector, most notably energy prices and productivity.

Industry's role in improving the performance of the Spanish economy in comparison with the euro area
The strength of Spanish manufacturing has played a decisive role in improving the performance of the Spanish economy compared to other major European economies. Between Q4 2019 and Q2 2025,10 Spanish manufacturing's value added rose by 9.4%, while in France and Italy it stagnated, and in Germany it fell by 3.2%. If Italian and German manufacturing had grown at the same rate as Spanish manufacturing, the GDP growth gap between their economies and Spain's would have been 50.6% and 20.0% lower respectively in the same period. Although during the pandemic the value added of Spanish manufacturing fell more sharply than in the euro area, since then, and especially from 2023 onwards, the Spanish manufacturing sector has experienced much higher growth than that of the euro area.
- 10
No value added figures for the manufacturing industry are available for Germany and Italy in Q3 2025, so we have used data up to Q2 2025 for ease of comparison.
The Spanish manufacturing sector has experienced much higher growth than that of the euro area
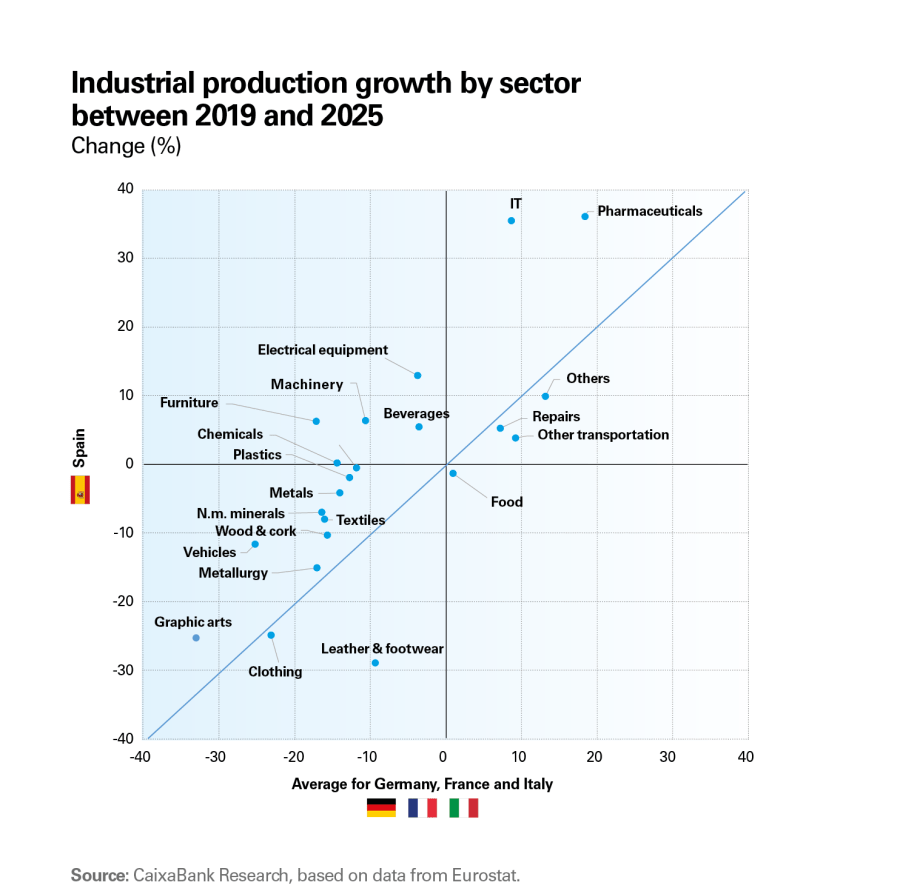
This strong performance is particularly remarkable given that, over the previous two decades (between 1997 and 2018), manufacturing's share of Spanish GDP declined by 5.9 pp, more than in any other major European country. However, as can be seen in the chart on the following page,11 there are notable differences between the different sectors of activity, in terms of both absolute and relative growth, compared with their counterparts in the large euro area economies. In the next section of this article, we will examine how improvements in the relative prices of energy inputs and the productivity of each sector help to explain these disparities.
- 11
Industrial production indices have been used to perform the analyses broken down by sector. These allow us to have data by sector up to September 2025, while GVA data by sector is only available up to 2023.
Manufacturing reverses the trend of its declining share of GDP
Energy prices, a competitive advantage
In recent years, Spain has experienced a paradoxical situation with regard to energy inputs. Although prices have risen in absolute terms because of the war in Ukraine and are above pre-Russian invasion levels, the increase has been smaller than in our main European competitors. This has posed a challenge for Spanish energy consumers, but at the same time it has improved their competitiveness, especially for industries whose main competitors are European.
The lower exposure to Russian gas and the greater use of low-cost renewables (solar and wind) have allowed Spanish industry to enjoy lower energy prices than its European neighbours. While the advantage gained for gas may only be temporary, the advantage it enjoys with electricity seems unlikely to be reversed in the short to medium term, as it is based on physical and geographical factors that are difficult to replicate.
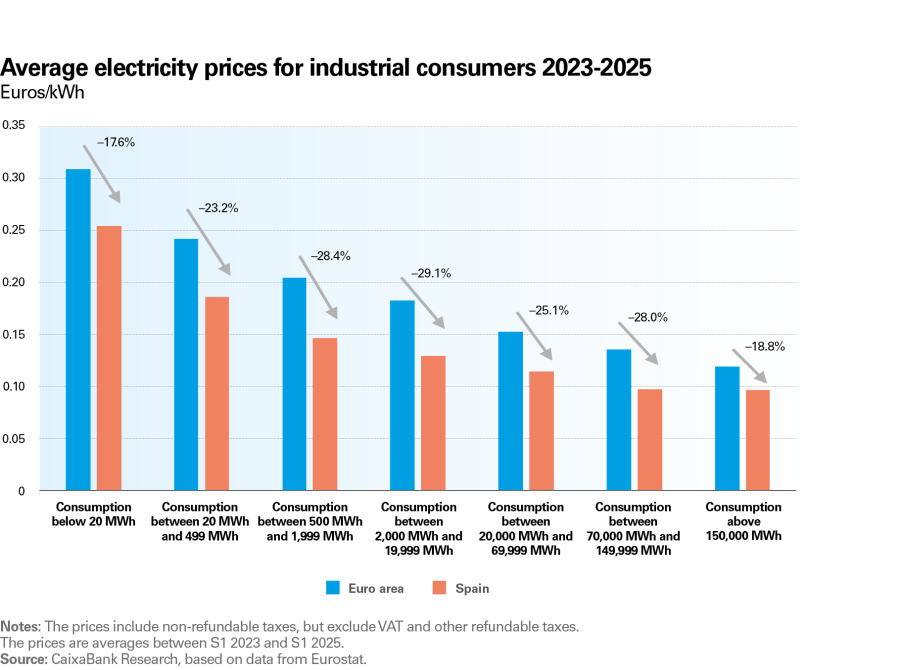
As the charts above show, the improved competitiveness of electricity prices for Spanish industries became particularly pronounced from 2023 onwards.12,13 This advantage has been across the board for all consumption bands, although it has been somewhat larger for medium consumers. Medium industrial consumers (band ID, with annual consumption between 2,000 and 20,000 MWh) have the greatest competitive advantage and, on average, have paid 29% less than the euro area average for their electricity since 2023. Large consumers (IG band, annual consumption above 150,000 MWh) have also seen a significant improvement in their relative position and pay substantially lower prices than in Italy or Germany, although higher than in France.
- 12
The price figures are from Eurostat, are comparable across countries and are based on the prices of bills paid by industrial end-consumers. The prices include non-refundable taxes, but exclude VAT and other refundable taxes.
- 13
See the article «Spain and its new energy advantage», in the Sectoral Observatory S1 2025.
The improved competitiveness of electricity prices for Spanish industries became particularly pronounced from 2023 onwards
Spain is performing relatively strongly, especially in energy-intensive industries
The performance of the various industrial sectors has been largely driven by their degree of energy intensity. To analyse this relationship, we have classified sectors according to the proportion of their cost structure accounted for by energy inputs, using input-output tables for each sector. Based on this classification, we compare their production trends.14 Those sectors with a higher share of energy costs are considered energy-intensive, while the rest are classified as less energy-intensive.
There are clear disparities between both groups. Energy-intensive industries were less hard hit during the pandemic and made a quicker initial recovery. However, they experienced a significant contraction after Russia invaded Ukraine in 2022. Although this decline levelled off in 2024, the production of energy-intensive sectors in the euro area has remained stagnant since then, at levels roughly 10% lower than in 2019. In contrast, less energy-intensive industries have been less exposed to higher energy prices and, in the euro area as a whole, are now at levels similar to those prior to the pandemic.
- 14
We will use industrial production indices to perform the analysis, broken down by sectors. These provide us with data for each sector up to September 2025, while GVA data is only available up to 2023 for each sector. As detailed in the final section of this article, there is a high correlation between growth rates in industrial production and gross value added, although GVA is increasing at a higher rate than industrial production for most sectors.
Rising energy costs have led to lower growth in energy-intensive industries than in non-intensive industries, but the competitive advantage of Spanish industries over their European counterparts has allowed them to outperform them. Thus, Spanish industrial production in the energy-intensive sectors was 5.6% below its 2019 levels in the first nine months of 2025. This decline is substantially smaller than that of the euro area as a whole (-11.9%) and the average for Germany, France and Italy (-14.6%). The production of non-energy-intensive industries grew by 3.3% in Spain in the same period, compared to an increase of 1.1% in the euro area and a fall of 4.4% on average in Germany, France and Italy.
Consequently, although growth in absolute terms has been more favourable in the less energy-intensive sectors, the more energy-intensive ones have played a central role in the growth gap between Spanish and European industries.
A major factor behind the poorer performance of energy-intensive industries is that they also face competition from outside the EU, from countries that have not suffered the same energy price increases caused by the Russian invasion of Ukraine.
Growth is strongest in the most productive industries
Energy is not the only factor behind the recent improvement in Spanish industry or the growth gap with respect to other European economies. Aside from energy intensity, Spain's industrial model is shifting towards a focus on activities with higher value added per worker.
Following the methodology we applied in a previous study,15 we classified industries according to their gross value added per employee. Between 2019 and 2025, the sectors with the highest value added in Spain have clearly outperformed their counterparts in the euro area: its average production in the first nine months of 2025 was 4.4% higher than in 2019, while in Germany, France and Italy it was 5.9% lower on average. This 10.3 pp gap is crucial to understanding why Spanish industry is performing better.
In contrast, the sectors with the lowest value added per worker have followed a negative trend both in Spain and in Europe. Between 2019 and 2025, industrial production in these sectors fell by 9.2% in Spain and, on average, by 11.4% in the other three countries. The 2.2 pp performance differential in favour of Spain is more modest in this case.
Of particular note is the exceptional performance of the Spanish pharmaceutical industry, whose industrial production was 36.3% higher in the first nine months of 2025 than it was in 2019, well above the 18.2% recorded by its main European competitors. Also noteworthy is the stronger performance, in the same period, of high value added and energy-intensive industries, including the chemical industry (+0.2% in Spain, compared to -14.1% in Germany, France and Italy), the paper industry (-0.4% in Spain, compared to -11.7% in Germany, France and Italy) and metal product manufacturing (-3.8% in Spain, versus -13.7% in Europe). The intersection between high value added and energy-intensive sectors is therefore a key driver of Spanish industry's stronger performance.
- 15
See the article «An overview of Spain’s manufacturing industry», in the Manufacturing Industry SR 2021.