
Key factors driving productivity improvements at the European regional level
In the third article of the Dossier «An analysis of European productivity», we conduct an in-depth analysis of the key economic factors driving productivity at the European regional level and their quantitative contribution.
In this article, we conduct an in-depth analysis of the key economic factors driving productivity at the European regional level and their quantitative contribution. After confirming in the previous article that there are notable differences in the evolution of the main variables related to productivity,1 it is now time to identify which ones have the most significant positive impact.
- 1
See the article «Factors shaping regional productivity disparities in Europe» in this same Dossier.
How to achieve a jump in productivity? An initial descriptive approximation
The aim of this article is to characterise the patterns exhibited by the most successful European regions (outperformers), understood as those that have shown better performance than their counterparts with a similar starting point, which has allowed them to improve their position in the productivity ranking of European regions over the last 20 years. We conduct a similar analysis in the following article, focusing on changes between deciles of the Spanish regions.2
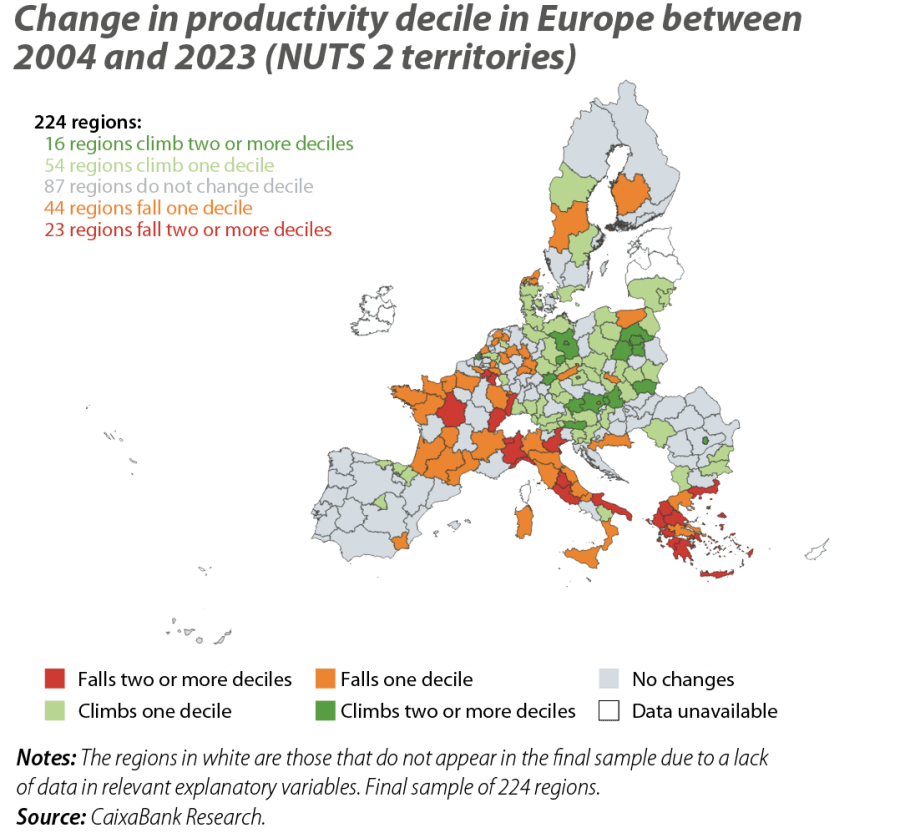
In order to analyse the movements among European regions in recent years, we grouped them into 10 deciles, from lowest to highest productivity.3 Between 2004 and 2023,4 61% of European regions (137 out of 224) have changed decile. Of these, 70 have risen and 67 have fallen.5 Among those that have improved, Germany stands out (17 out of its 38 regions have moved up from their starting decile, including all 8 regions in the East of the country), Austria (7 out of 9), Poland (11 out of 17) and Denmark (3 out of 5). In contrast, France has recorded no improvements, and Italy only 2 (out of 21 regions). Among the regions that have fallen back, Greece stands out, with all of its 13 regions dropping by at least one decile and 11 of them by more than 1; and Italy, with 16 setbacks (76% of its regions), particularly in the South of the country (Mezzogiorno), where 6 out of 8 regions have seen their position deteriorate. France also stands out negatively, with 14 regions falling from their starting decile (out of 21).6
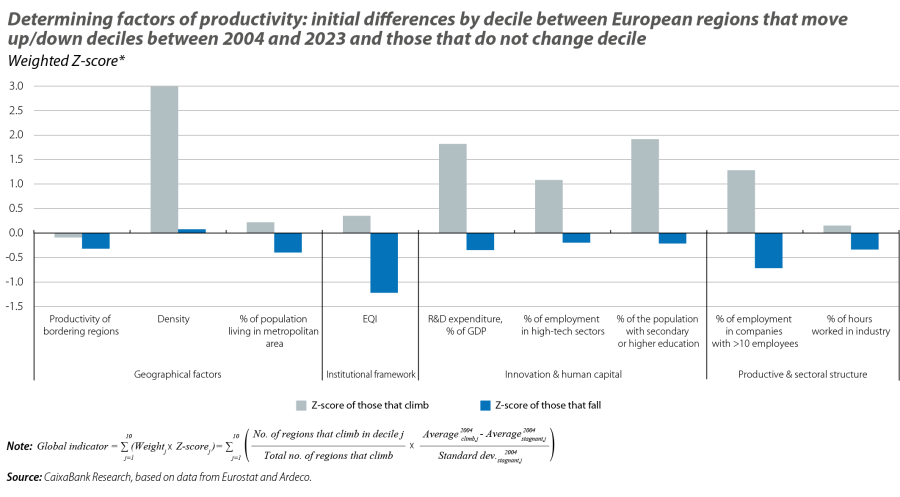
We begin with a descriptive analysis that helps provide visual evidence of the main variables in our sample7 for which a good (bad) relative starting position in 2004 is particularly relevant for moving up (down) a decile between 2004 and 2023.8,9 In the case of the regions that have climbed deciles, the main variables in which they initially outperform regions with similar productivity are primarily geographical components and those related to human capital and innovation:10 population density, the percentage of employment in high-tech sectors, the percentage of the population with secondary or higher education, and investment in R&D. Additionally, having a larger business size than other regions with similar productivity levels will help a European region to subsequently climb the productivity ranking. Conversely, one of the two main factors that predict subsequent declines between deciles is insufficient institutional quality, which highlights the importance of healthy institutions that ensure a level playing field in order to prevent a region from falling down the ranking. The other factor is a low percentage of employment in companies with more than 10 employees.
- 2
See the article «The key ingredients for Spain’s regions to boost productivity» in this same Dossier.
- 3
The 10% of regions with the lowest level of productivity form the first decile, the next 10% comprise the second decile, and so on, successively. Finally, the 10% of European regions with the highest level of productivity correspond to the 10th decile.
- 4
In reality, we use the periods 2003-2005 and 2022-2024, taking, for each one, the average productivity and explanatory variables of the available years. For simplicity, in the remainder of the article we will refer to these periods simply as 2004 and 2023, respectively.
- 5
Although the total number of upward and downward movements between 2004 and 2023 is the same, this does not necessarily mean that the number of regions that have improved matches the number of regions that have deteriorated. This is because some regions have experienced more than one rise or decline over the period. Moreover, not all movements are of a single decile; in some cases, there has been a jump of several deciles. Therefore, from a strictly mathematical point of view, the number of regions that have risen may not necessarily match the number of regions that have fallen, even though the total number of movements is balanced.
- 6
The data from Spain are discussed in detail in the article «The key ingredients for Spain’s regions to boost productivity» in this same Dossier.
- 7
These variables are explained in detail in the article «Factors shaping regional productivity disparities in Europe» in this same Dossier.
- 8
In general, these upward movements involve climbing from one decile to the next, although there are some cases (16 out of 70) in which, after 20 years, a region ends up two or more deciles higher than where it started.
- 9
Specifically, the normalised difference, or «Z-score», is calculated (normalising allows us to compare magnitudes for the different variables) in 2004 of the average determining variables of productivity between European regions that climb/fall between deciles between 2003-2005 and 2022-2024 and those that do not change decile, for each decile. Finally, this score is weighted taking into account how many regions climb deciles in each decile with respect to the total in the sample.
- 10
We make this comparison by decile and then weigh the result according to the number of regions that have improved in each decile with respect to the total number of regions that improve in the whole sample.
This analysis, by considering the entire productivity distribution, may conceal significant variations in the factors which initially distinguish the regions that progress from those that stagnate, depending on the initial level of productivity. In deciles 1-3, it is notable that the regions which have moved up a decile in the last 20 years initially had a much higher density. In contrast, in deciles 8-10, the most notable differences between regions that progress and those that stagnate are observed in education and, to a lesser extent, institutional quality and the productivity of neighbouring regions. Finally, in deciles 3-7, where Spain’s autonomous communities are located, the regions that have managed to climb deciles stand out for having higher density and relatively larger metropolitan areas, a higher percentage of the population with secondary or higher education, higher percentages of hours worked in industry, and higher institutional quality. The importance of geographical constraints in these intermediate deciles suggests that, in the depopulated areas of Spain, the absence of agglomeration effects represents a significant obstacle to climbing the European productivity ranking.
The key ingredients for progress: geography, institutions, and human capital and innovation
In this second part of the article we proceed to characterise, using more sophisticated econometric techniques, what the most successful regions – or outperformers – are like. These regions have managed to stand out due to a greater improvement in productivity relative to their counterparts at the starting point. To characterise them, we estimate a multiple linear regression with the regions that have improved their relative position using their productivity growth between 2004 and 2023 as the dependent variable, compared to the average productivity growth of those regions that have stagnated but were in the same decile in 2004 (we will henceforth refer to this variable as differential productivity growth). Subsequently, we use the decomposition of the variance to study the relative weight of factors related to demographics,11 institutional quality,12 technology and human capital13 and productive structure,14 presented in the previous article, in order to explain the differential productivity growth for the regions that have improved their relative position.15
The results (see last chart) show that the four categories of variables included in our analysis play a very important role in explaining why some regions have managed to «take off» over the last 20 years in terms of productivity and grow more than other regions that had a similar starting position. Specifically, these four categories together account for almost 85%16 of the differential productivity growth of the outperformers.
- 11
Density, percentage of the population living in metropolitan areas (defined as functional urban areas), percentage of the population living in urban areas and cities, and the productivity of bordering regions.
- 12
The European Quality of Government Index (EQI).
- 13
Investment in R&D, the percentage of employment in high-tech jobs and the percentage of the population with secondary or higher education levels.
- 14
Hours worked in industry as a proportion of the total, hours worked in services as a proportion of the total, the stock of physical capital, as well as the percentage of workers in companies with more than 10 workers.
- 15
This method is also known as Shapley decomposition. Specifically, we use as regressors the levels in 2004 of the explanatory variables and interactions of their level in 2004 with their differential growth (i.e. for each region that has climbed deciles, their growth minus the average growth of those that have stagnated and started from the same initial decile) in order to incorporate convergence effects. The results are similar if instead of the initial level we take their initial level relative to the initial level of those that stagnated by decile.
- 16
We also include fixed country effects, for countries with more regions that climbed deciles, in order to capture idiosyncratic factors at the country level not absorbed into the rest of the variables. These fixed effects have a contribution of 6.4% to the total variance.
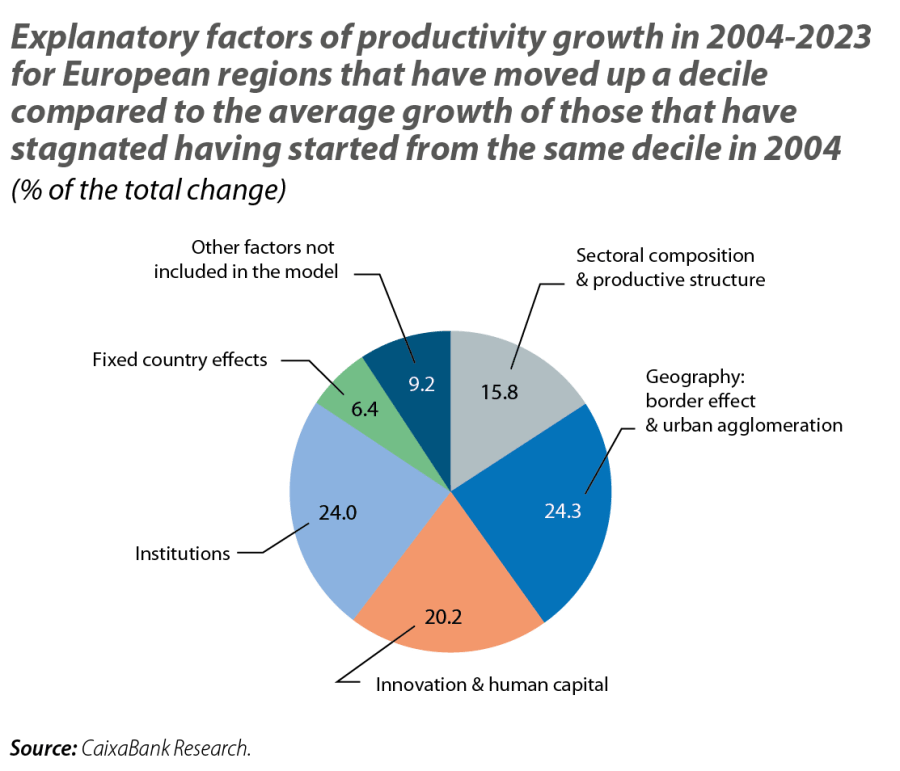
Geographical conditions and institutions appear to play a particularly key role. Specifically, geographical factors account for around a quarter of the differential productivity growth. When we examine which variables in this sphere are statistically significant for differential productivity growth, having an initially high density and the growth in the percentage of the region's population living in urban areas stand out. This suggests the importance of economies of agglomeration, a concept coined by economists to emphasise that the physical proximity of people, workers, companies, etc. enriches us.17 Hence the importance of public policies that help to create vibrant and dynamic urban centres.
Also, the institutional quality variable, EQI, accounts for around a quarter of the differential productivity growth in regions that have improved their relative position between 2004 and 2023, which underscores the importance of considering institutional variables when analysing the productivity growth of European regions. This result aligns with the economic literature, championed by the Nobel laureates Daron Acemoglu and James Robinson, which documents the importance for economic growth of strong institutions that respect property rights and stimulate investment and the flourishing of a broad middle class.
Next, the variables related to human capital and innovation explain around one-fifth of the differential productivity growth in regions that have improved their relative position between 2004 and 2023. More than two-thirds pertain to investment in R&D and employment in high-tech sectors.
Finally, the variables that make up the regions’ productive structure account for slightly less than one fifth of the differential productivity growth in regions that have improved their relative position between 2004 and 2023.18 Among the variables in this category, of particular note is a positive and statistically significant relationship between employment in large companies in 2004 and differential productivity growth. This should come as no surprise, given the abundant literature documenting a positive relationship between company size and productivity: large companies tend to last longer, export more, have more diversified sources of financing and are more innovative.19
- 17
See the article «The urban factor of the labour market» in the Dossier of the MR06/2016.
- 18
100% here includes 9.2% corresponding to other factors not included in our analysis, so the proportion is relative to the total of the explained variance (90.8%) and the unexplained variance (9.2%).
- 19
See the Focus «Sectoral specialisation penalises the productivity of the Spanish economy» in the MR11/2023.