The new map of US goods imports
The return of tariffs as a central tool of US economic policy has marked a turning point in 2025. One of the explicit objectives of the White House’s new tariff strategy is to reduce the persistent trade deficit in goods. However, far from producing an orderly reduction, the succession of announcements and the irregular implementation of tariffs have generated significant distortions in trade flows, especially in imports. In this context, the data available to date does not yet show any clear change in the trade deficit. However, these distortions are indeed leaving a mark on the composition of imports by geographical origin. Below, we analyse how the country’s various trading partners have reacted and we provide an overview of these changes.

Foreign trade in the pre-tariff Trump era
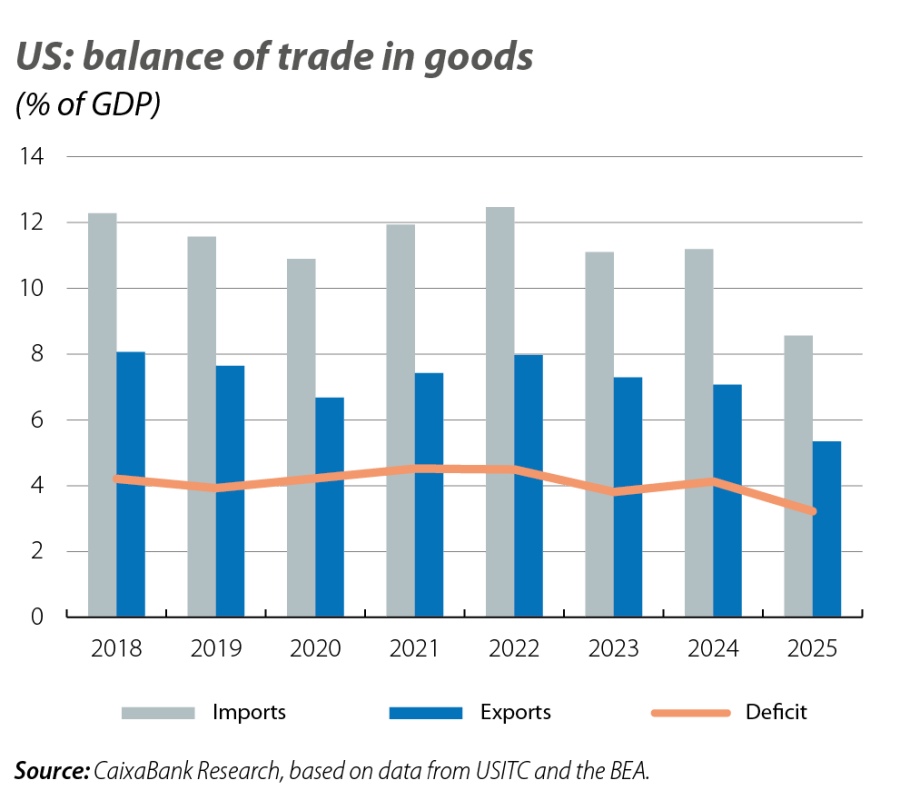
Before analysing what happened in 2025, it is worth reviewing some structural features of US foreign trade. Compared to other advanced economies, the US is a relatively closed economy. On average, during the period 2018-2024, imports of goods accounted for 11.6% of GDP, while exports reached just 7.4%. This pattern has translated into a persistent trade deficit in the balance of goods, which in terms of GDP stood at around 4.2% in 2024 (equivalent to some 1.2 trillion dollars). All of this coexisted with a historically low average applied tariff, of around 2%.
An atypical year for US foreign trade
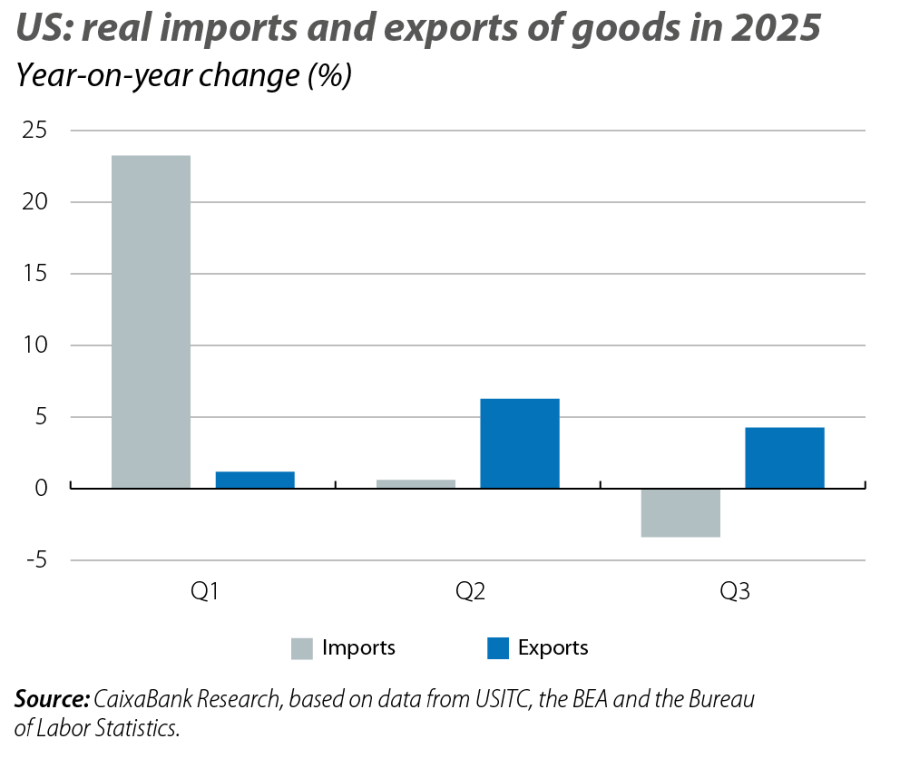
In real terms, US exports have grown in 2025 at a year-on-year rate of 5% during the first three quarters, a figure comparable to that observed in previous years. This relatively dynamic behaviour can be explained, in part, by the absence – at least for now – of tariff reprisals from the country’s main trading partners. Moreover, the resilience of the global economy and the competitiveness of some export sectors have cushioned the negative impact of trade uncertainty.
The behaviour of imports, on the other hand, has been notably more volatile. The first feature to highlight is the sharp rebound observed in Q1 2025. In year-on-year terms, real imports increased by around 25% from January to March, an exceptional growth rate that was driven by an anticipation effect: consumers, businesses and distributors brought forward purchases in order to stockpile before the new tariffs came into effect.
This increase was followed by a partial correction in Q2. Imports fell by 14% quarter-on-quarter, although they remained at levels similar to those of the previous year, with an annual growth of 0.6%. This pattern suggests that the subsequent adjustment did not fully correct the initial hoarding. In Q3, imports remained stable compared to the previous quarter, but with a 4% year-on-year decline, which could already reflect a more direct impact of tariffs on purchasing decisions. However, due to the significant offsetting effect between quarters, the aggregate balance continues to show an increase in imports. In the cumulative period from January to September, imports grew by 6% compared to the same period in 2024.
Beyond the aggregate trends, one of the most key developments in 2025 was the change in the geographical pattern of US imports.
US imports are highly concentrated by place of origin. Between 2018 and 2024, the main trading partners – the EU, China, Canada, Mexico, Japan and the United Kingdom – accounted for nearly 70% of total imports on average. China has historically been the US’ main trading partner in terms of imports, although its share has been steadily declining: from 21% of the total in 2018 to 13% in 2024. In 2025, this trend accelerated significantly, with a share that is slightly below 10%.
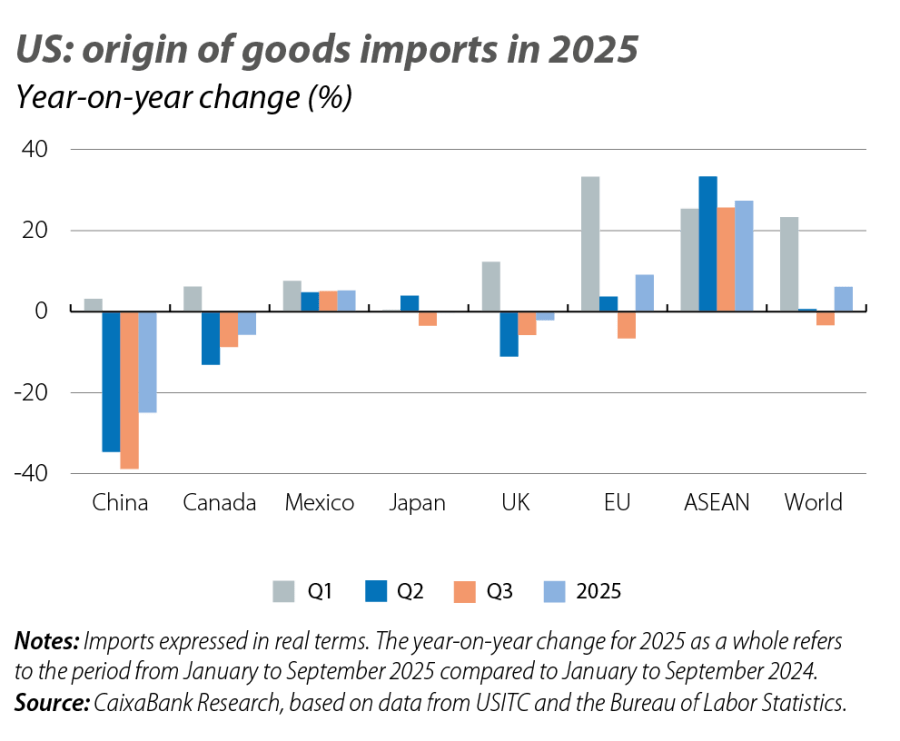
During Q1 2025, the anticipation effect was widespread and imports from almost all trading partners increased, with the EU standing out in particular. However, the subsequent reversal was very mixed. The most striking case is China, with a clear decoupling in view of a 25% drop in imports in the cumulative total for 2025 compared to the levels of 2024 (in the same period from January to September). China was the country most penalised in terms of tariff levels and it is the one with which, so far, only a partial agreement has been reached.1 US imports from that country contracted sharply and persistently since the start of the escalation of trade tensions. To a lesser extent, declines are also observed in imports from Canada (–5%). With the EU, a different dynamic is observed: the increase in the demand for imports is sustained throughout the first half of the year and imports for the year 2025 to September are almost 10% above the levels accumulated in the same period of the previous year.
The reconfiguration of imports by origin has also resulted in an increase in imports from ASEAN countries, which in the year-to-date have risen by 27% year-on-year, and have gone from representing 8% of total imports in 2018 to 13% in 2025.
This change in the source of imports helps to explain the apparent discrepancy between the average tariff implicit in the measures announced and the effective tariff that is finally collected at customs. According to our estimates, and assuming an import pattern similar to that observed in 2024, the set of measures applied to date would imply an average tariff of around 13.8%. However, the effective tariff collected has been significantly lower and reached a maximum of 10.6% in September. This difference largely reflects the geographical reconfiguration of imports. Thus, although the total volume of imports has not fallen significantly, an increasing portion of foreign purchases is coming from partners that are subject to lower levies, while the proportion coming from partners subject to higher tariffs has fallen (China being the most notable case), and this reduces the average rate effectively collected.
Overall, the analysis of the 2025 data shows that the new tariffs have not yet resulted in a reduction in the US goods trade imbalance, but they have caused a structural change in the geographical composition of the country’s imports. The direct decoupling with China and the greater connection with ASEAN countries have intensified significantly, indicating a reconfiguration of supply chains rather than a mere contraction of trade. Thus, this process does not seem to be substantially reducing the total dependency on imports, but rather redistributing it among partners.
- 1
On 31 October, the US agreed to lower the average tariff to around 30%, and the additional levy linked to fentanyl from 20% to 10%. China agreed to defer rare earth export controls for one year and to resume purchases of US soybeans.
Geopolitics
We analyse the major geopolitical trends and thier effects on the financial markets and the economy.