
Energy tensions, inflation and monetary policy in the euro area
In March, the bombings exchanged between Iran and the US and Israel caused significant stress in energy commodities; Brent crude oil fluctuated around 100 dollars per barrel throughout the month, while TTF gas did so between 50 and 60 euros per MWh. This points to a rebound of inflation and has led the markets to price in rate hikes at the ECB’s forthcoming meetings.
Iran: an energy shock, but not like in 2022
The conflict in the Middle East represents a disruption to global supply and, therefore, may drive up inflation and hinder economic activity. The question is whether the magnitude, persistence and propagation of the disruptions will result in a change in the economic outlook or merely a recalibration of forecasts. Although uncertainty is very high, the nature of the shock brought back memories of Russia’s invasion of Ukraine in 2022. But the two shocks are different.
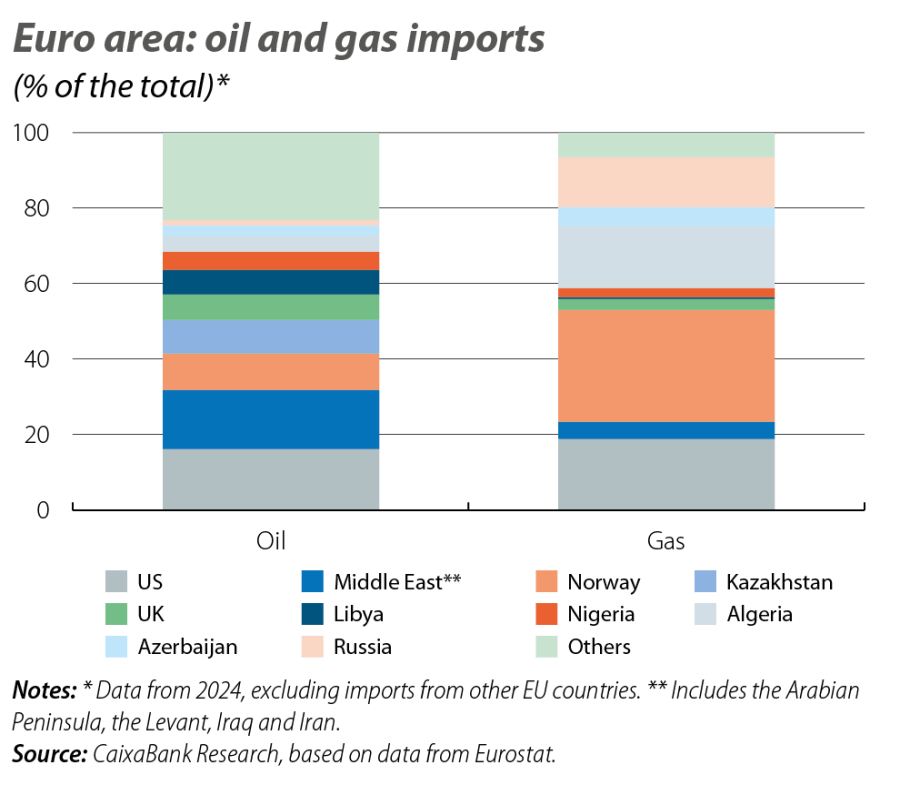
In 2022, the stress was not only a matter of rising oil and gas prices but also a problem with energy flows themselves: Europe had to reconfigure its supply chains due to its high dependency on Russia. In contrast, Europe’s direct dependencies on the Middle East are limited (see first chart) and the supply disruption mainly affects Asia.
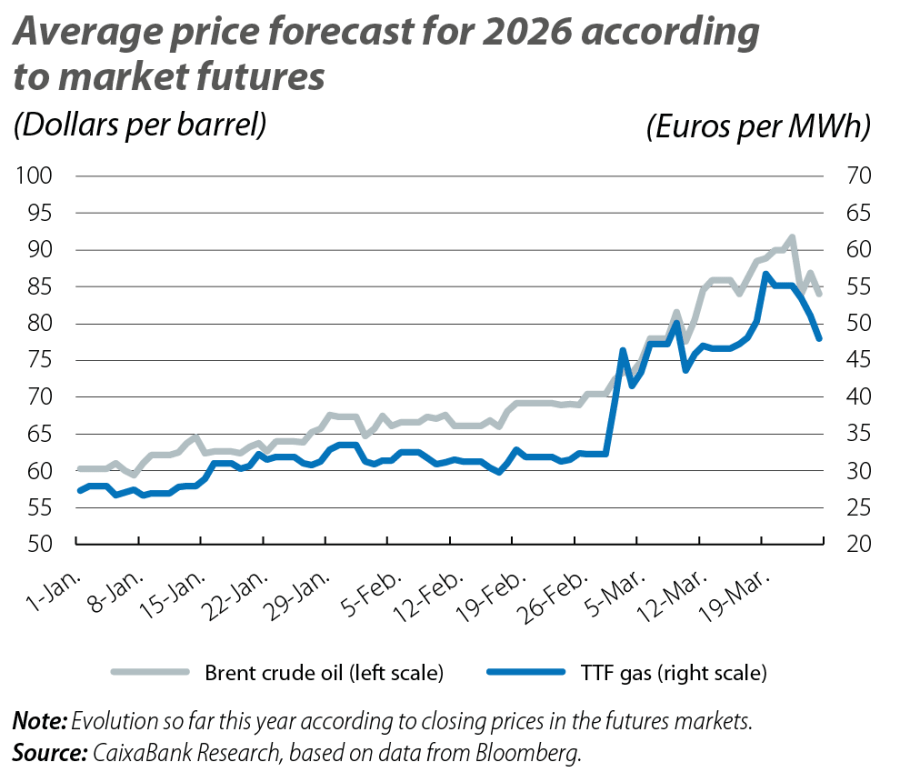
On the pricing side, between February and March, the futures markets shifted from quoting averages for 2026 of 65 dollars per barrel of Brent and 30 euros per MWh of TTF gas to between 80 and 90 dollars for Brent and 45 and 55 euros for TTF (see second chart). Despite the significance of the change, the shock was much stronger in 2022: whereas in mid-2021 the respective prices for 2022 were quoted at 70 dollars and 25 euros, the year’s average ended up being 100 dollars and 130 euros, resulting in annual energy inflation of nearly 40% in the euro area.
The macroeconomic and monetary environment is also different. In 2022, the war coincided with the post-pandemic reopening of the global economy. The interaction between the energy shock and the imbalances in supply and demand caused a perfect storm for inflation to spread. Furthermore, monetary policy was in a highly expansionary position,1 which slowed down the ECB’s response.
In 2026, the European economy is in a better starting position. Without the imbalances or pressures in the global supply chains of 2022, the euro area’s economic activity has maintained moderate growth, while monetary policy has been in a neutral position for several quarters now and the ECB’s «meeting by meeting» and «data-dependent» approach to decision-making allows it to react swiftly.
The ECB also has the buffer of inflation expectations anchored at the 2% target in the medium term. However, there may be an unfavourable difference compared to 2022, as expectations tend to be heavily influenced by recent memories: whereas the past experience in 2022 was a decade of low inflation, in 2026 the latest inflationary crisis remains fresh in the collective memory.
- 1
In February 2022, the ECB had the official rate at a historic low of –0.50% and was implementing unconventional policies, including both net asset purchases (PEPP and APP) and long-term liquidity injections (TLTRO-III).
Inflation: direct and indirect impacts
Energy accounts for just under 10% of the euro area’s price basket (HICP) and its inflation shows a close link with gas and oil prices. Thus, we estimate that the range of Brent and TTF futures quoted in March could translate into energy inflation of between 5% and 12% for 2026 as a whole in the euro area, before dropping to 0%-1% in 2027.2 Starting from a headline inflation rate of 2%, energy prices could mechanically cause an increase in the HICP to 2.5%-3.1% in 2026 for the euro area as a whole, easing back to 2% in 2027 (see third chart).
- 2
We use paths for oil and gas prices according to the futures referenced between March and December 2026 and quoted throughout March. The range is framed between the 30% and 99% price percentiles. These paths translate into energy inflation with linear regressions that fit well: one between oil and the HICP for fuels and lubricants, and another between gas and the HICP for energy excluding fuels.
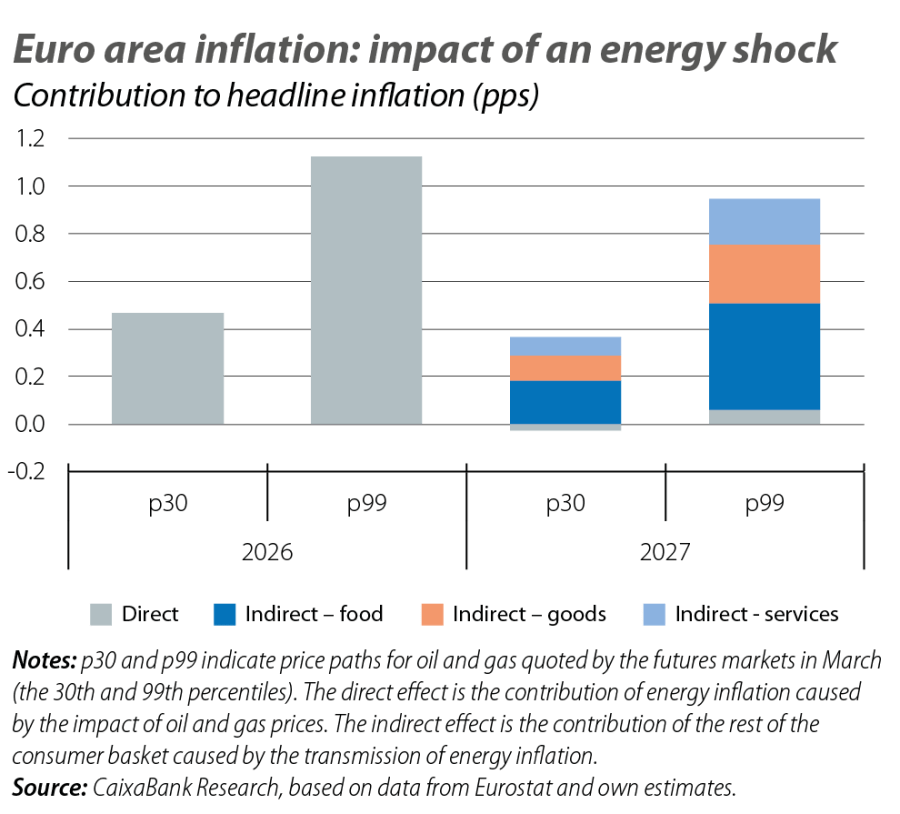
A persistently significant increase in energy costs could also impact the prices of the other components of the consumer basket through the various economic sectors’ energy dependencies.3 The input-output tables for the euro area show oil and electricity intensity at the sectoral level and provide an approximation of the potential of this indirect effect on inflation. To estimate it, we transfer the energy intensities of each sector to the different components of the HICP and stress their prices with the range of energy inflation rates between 5% and 12%.4,5 Assuming that the strength of transmission is proportional to energy intensity, the indirect impact can be significant, although in practice it would affect inflation with a time lag6 and would probably only materialise with high intensity (as predicted by the exercise) in a scenario with persistently significant stress in energy prices.
- 3
See the article «Geoeconomic exposure and strategic relevance of the Middle East» in this same Monthly Report.
- 4
We reproduce the methodology used by Fagandini et al. (2024), «Decomposing HICPX inflation into energy-sensitive and wage-sensitive items», ECB Economic Bulletin 3/2024, to calculate an «energy-sensitive» HICP. After assigning energy intensity among 103 items of the HICP, we transmit to them the increase in energy costs based on the ratio between the energy intensity of each component and that of purely energy items.
- 5
The exercise identifies food and services related to transport and the repair of goods as the most likely sectors to suffer indirect effects from energy.
- 6
After the peak in energy inflation in 2022, it took 9 months for the inflation peak in non-energy goods to materialise, while the time lag was 10 months for food, and 14 months for services.
Constraints for the ECB
This range of impacts does not differ much from what was being quoted by the markets in March, when inflation swaps pointed to rates of slightly above 3% and 2.5% one and two years ahead, respectively. At the same time, the markets were pricing in between 2 and 3 ECB rate hikes during 2026, placing the depo rate at the end of the year between 2.50% and 2.75%.
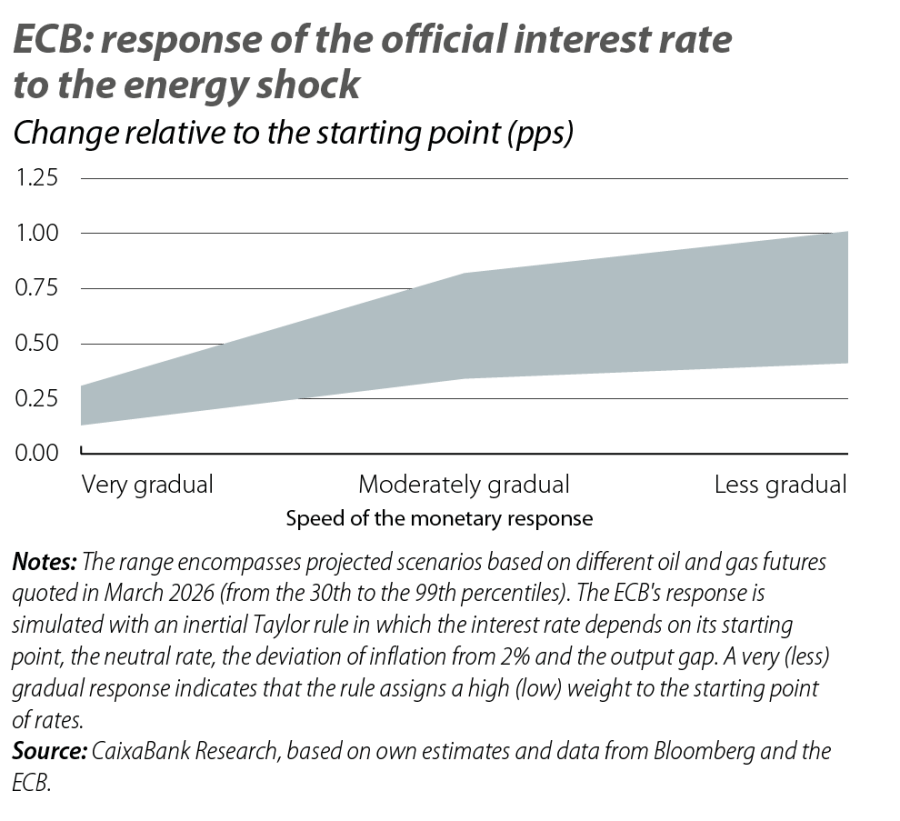
We can assess these expectations based on the so-called Taylor rule, which projects the interest rate that the ECB should set according to the evolution of economic activity and inflation.7 In the fourth chart, we present a range of responses according to the inflation sensitivities analysed previously, the potential impacts on activity (which are currently estimated to be contained)8 and how gradual the ECB’s response is.
- 7
Based on De Mazelis et al. (2023), «Monetary policy strategies for the euro area: optimal rules in the presence of the ELB», ECB Working Paper, we use the rule: \(i_t=\rho(i_{t-1}-i_{t-1}^\ast)+(1-\rho)\lbrack1,5\cdot({\mathrm\pi}_{\mathrm t}-2)+{\mathrm y}_{\mathrm t}\rbrack\), where i* is the natural interest rate, π is inflation and y is the output gap (difference between observed and potential GDP). We assume a nominal natural rate of interest of 2% and an initial output gap of zero. The parameter ρ measures the gradualness of the response.
- 8
Based on the behaviour of energy futures throughout March, most estimates point to a markedly more moderate impact on economic activity than on inflation (reflecting the euro area's low direct exposure and its greater energy resilience). Thus, we feed the Taylor rule with the adverse and severe GDP scenarios presented by the ECB last March, projecting growth within the 0.4%-1.2% range.
This exercise does not rule out the possibility that the ECB could barely react at all to the energy shock, relying instead on its transitory nature and the favourable starting point of the euro area’s economy and monetary policy. Nevertheless, there is also the possibility of a scenario in which the combination of a more severe and persistent energy shock and a swift response from the ECB could lead to a tightening of interest rates similar to that priced in by the financial markets in March. In such a scenario, the ECB could shift from a clearly neutral monetary policy to interest rates that would lie between the upper band of what would still be considered neutral and the lower band of a restrictive policy.
Geopolitics
We analyse the major geopolitical trends and thier effects on the financial markets and the economy.