
What markets tell us about macroeconomics
How do financial markets reflect macroeconomic surprises? Can we identify, in financial asset prices, which macroeconomic narrative dominates investor sentiment?
This article presents an analytical model1 to identify the macroeconomic factors that drive financial markets in the euro area and the US. It does so on the basis of correlations between different asset classes and daily high-frequency market data, spanning from June 2005 to the present.
- 1
The model is based on the one proposed by Matteo Crimella of Goldman Sachs in the 2019 article «French and Italian Spreads: A Tale of Macro, Policy and Politics».
Methodology
For each region, we examine daily data from different types of financial assets: interest rates (overnight rates and sovereign bonds), inflation expectations (inflation swaps), equities (stock and volatility indices), exchange rates and commodities (gold, oil and gas).2
We then analyse the co-movements between these assets and extract patterns (in the form of common factors) that allow us to identify different macroeconomic drivers of market movements.3
Main drivers
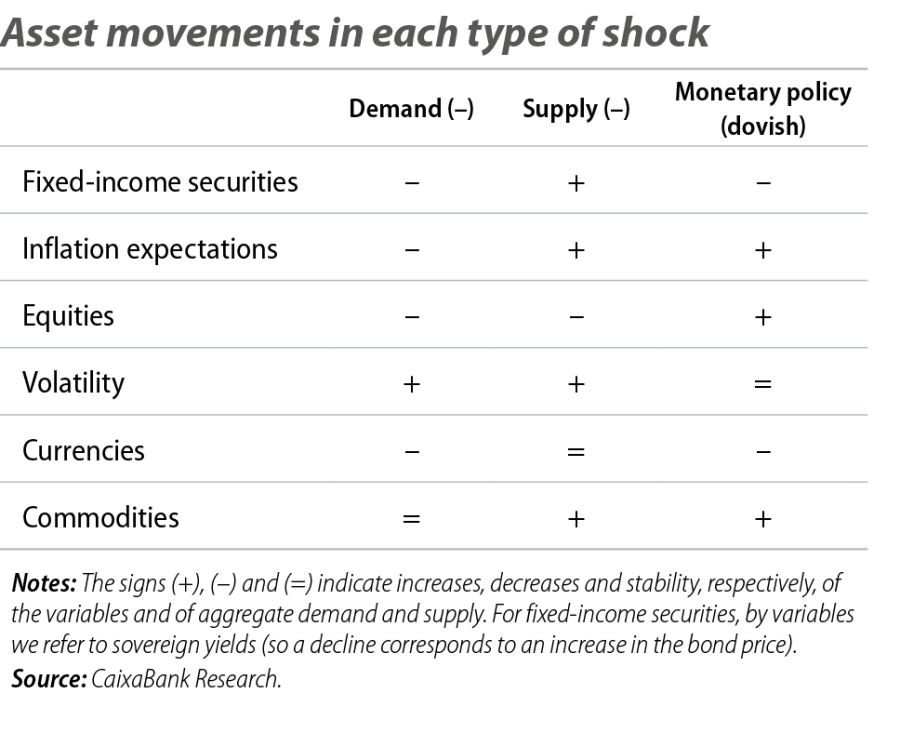
Our exercise identifies three major categories of macroeconomic shocks: demand, supply and monetary policy. Intuitively, an increase in demand stimulates both economic activity and price growth, which is reflected in rising stock market prices (higher corporate profits), inflation expectations and higher interest rates (both to compensate for inflation and due to the possibility of central bank rate hikes). Conversely, a contraction in supply depresses activity and raises prices (this may be caused by an increase in the cost of commodities, such as oil), resulting in stock market declines and higher interest rates (amid expectations of monetary tightening to combat inflation).
Finally, a dovish monetary policy shock (e.g. when a central bank signals it will cut interest rates) is associated with declines in sovereign rates, a depreciation of the domestic currency, and an increase in stock markets and inflation expectations (due to the support of monetary easing for economic activity).
Formally, these three macroeconomic market drivers are identified through the various expected co-movements between financial variables, as summarised in the first table.4
- 4
The three drivers correspond to the first three main components of the PCA. The resonance between the weight assigned by the PCA to each financial variable and the direction of the financial markets (increases or declines in the stock market, interest rates, etc.) determines which of the three drivers «dominates» a market session.
Macro drivers from a historical perspective
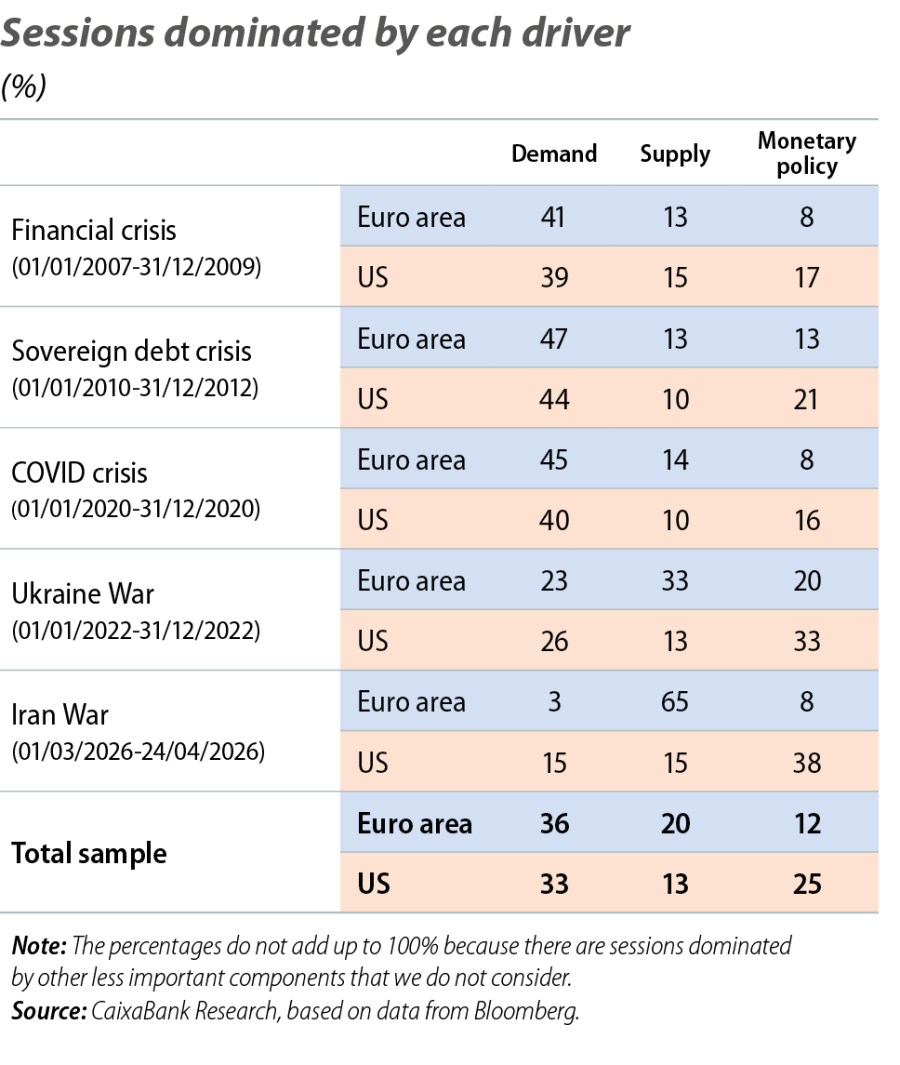
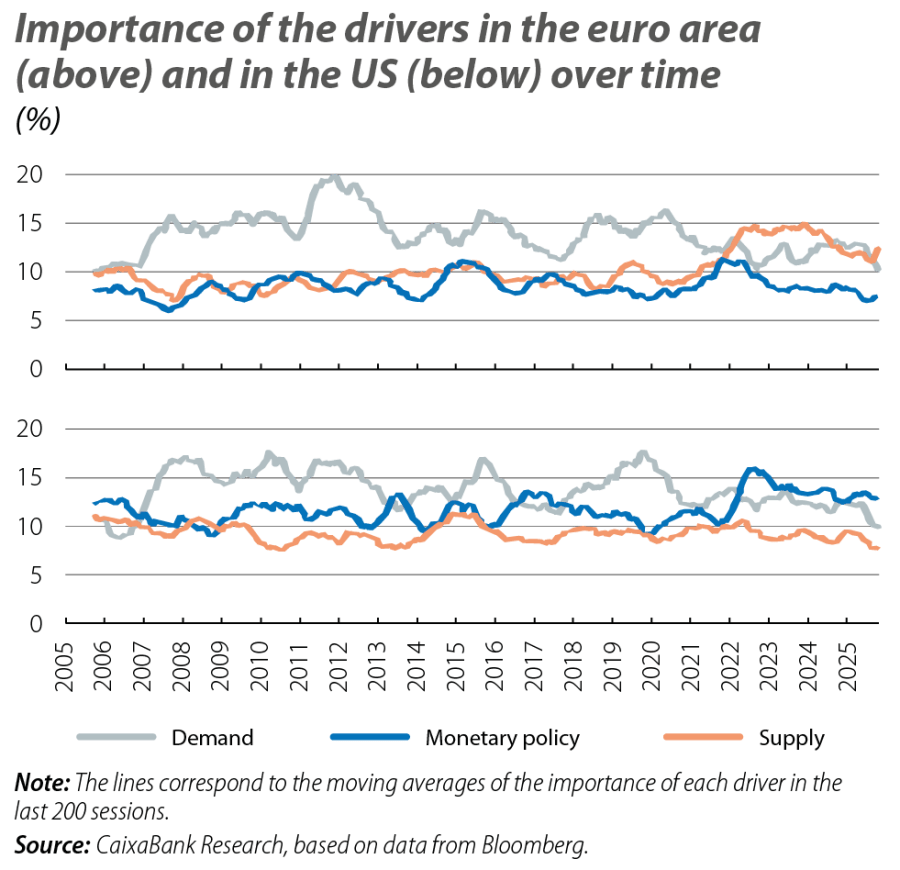
The model’s results show that the nature of the shocks that drive financial markets varies widely depending on the historical episode and the region analysed. In the euro area, recessions – the global financial crisis, the sovereign debt crisis and the COVID-19 pandemic – were clearly dominated by demand shocks, which accounted for around 40%-50% of the sessions. This reflects an environment marked by deteriorating growth, stock market declines and falling inflation expectations. However, recent geopolitical crises present a different dynamic. During the war in Ukraine, the weight of supply shocks surged to 33%, during current tensions in the Middle East this figure has risen to 65%, highlighting Europe’s high sensitivity to energy and supply disruptions. In the US, demand shocks also dominated during the economic recessions of 2008 and the pandemic, albeit with less intensity than in Europe, while monetary policy shocks play a structurally more significant role throughout the sample.
In fact, during the war in Ukraine, and especially during the recent Iran episode, the dominant driver in US markets has been monetary policy, accounting for 33% and 40% of sessions, respectively. Together, these results suggest that markets interpret the Iranian shock primarily as a supply-side inflationary risk in the euro area. In the US, in contrast, the market response is dominated by its implications for the future path of the Federal Reserve, given the relatively lower vulnerability of the US economy to increases in external energy prices, due to its status as a net energy producer and exporter.
Observations and technical notes on methodology and models
Although it falls outside the scope of this article, our model reveals seemingly technical details which nevertheless provide «narrative» insights worthy of discussion.
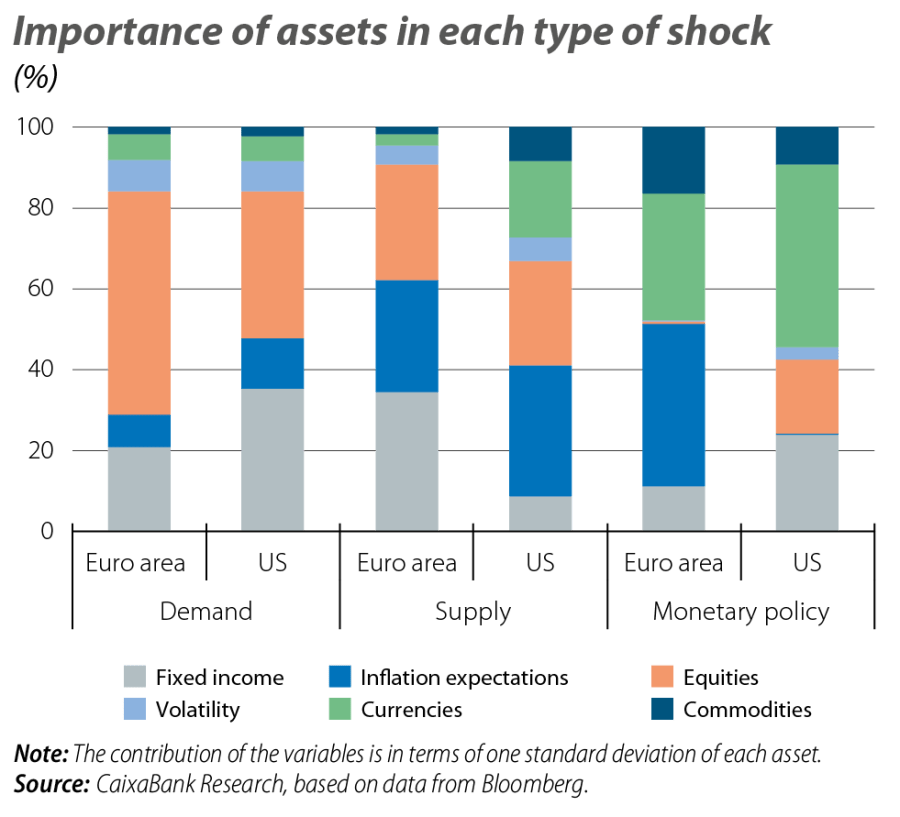
Firstly, the most notable reading is the difference between the monetary policy shocks in the US and in the euro area.5 While the movements in both regions are in the expected direction, the exercise identifies different sensitivities and magnitudes between the two regions. In the euro area, equities are relatively less sensitive, generally speaking, to monetary policy shocks. This may reflect the greater weight of the financial sector in European stock market indices (a sector which tends to benefit from higher interest rates, unlike the rest). Another similar observation is the low sensitivity of inflation expectations to monetary shocks identified by the model in the US – a result consistent with the academic literature.6
Secondly, the analysis makes it possible to calibrate the sensitivity of each asset class to different types of shock. For example, equities show greater sensitivity in demand shocks than in supply shocks. In the case of fixed-income securities, sensitivity varies by region: in the euro area, it shows a similar magnitude in response to supply and demand shocks, whereas in the US it is greater in response to demand shocks.
Finally, it is difficult to decouple the movement of commodities from that of other assets using only the three drivers described. If we expand the number of drivers analysed, we obtain components with less aggregate explanatory power but which offer greater precision in explaining specific co-movements between assets. This allows us to observe how fluctuations in gold prices are heavily influenced by drivers that were of limited aggregate importance in the past, but which have recently surged.7
- 5
Technically, shocks in one region and another are not comparable, at least quantitatively, as they have different weights on different (and also non-comparable) assets.
- 6
R.S. Gürkaynak, B. Sack and J.H. Wright (2010). «The TIPS yield curve and inflation compensation». American Economic Journal: Macroeconomics, 2(1), 70-92.
- 7
In technical terms, the PCA only identifies the seventh component as being a significant driver of gold prices, whereas until mid-2024 it had limited explanatory power. However, in 2026 there have been weeks when this component has been the one with the greatest aggregate importance.
Macrofinance
What factors will determine the evolution of interest rates, investment sentiment and macro-financial conditions in general?