Shadows (and some light) in Europe’s industrial decline
The Industrial Accelerator Act, presented by the European Commission at the beginning of March, outlines its response to the EU’s weakening industrial base. It is structured around a set of quantitative objectives: a general one, to raise the sector’s share of the economy to 20% of GDP by 2035 (14% in 2025), and several specific ones, aimed at boosting productive capacity and reducing strategic dependencies in critical segments. In pursuit of this latter goal, it includes minimum European content requirements and maximum thresholds for third countries in terms of foreign direct investment and public procurement.

This approach risks import substitution leading to costlier inputs and a further erosion of competitiveness, without addressing structural deficiencies in investment, scale, and positioning in value chains for the dual green and digital transition.1 The shocks accumulated since 2020 – COVID-19, the war in Ukraine, energy and trade tensions – have intensified the loss of European industrial dynamism, but they do not fully explain it. In this context, the solution does not lie in setting numerical thresholds, but in creating the financial, legal and market conditions necessary to reverse the trends that have led to the decline of European industry.2
- 1
See J. Zettelmeyer (2025). «Draghi on a shoestring: the European Commission’s Competitiveness Compass».
- 2
See the Focus «How far has the EU progressed on the Competitiveness Compass?» in the MR04/2026.
Widespread structural weakness despite technological momentum
Since the global financial crisis, European industry has shown weakness and a high exposure to successive shocks. In 2025, production volumes were just 5% above 2007 levels, resulting from an average annual growth rate below 0.3% (see first chart). This general pattern is found across the sector, although different dynamics are observed depending on the industrial activity. The poorest performance is found in manufacturing with a low or low-medium technological content, where output has recorded a cumulative decline of between 15% and 20%. Given the greater importance of production costs as a competitive element in most of these industries (clothing, footwear and furniture, among others), their weakness points to a structural adjustment driven by intensified competition from Asia, led by China since its entry into the WTO in 2001. In other cases, such as metallurgy, the loss of international competitiveness has been exacerbated by state aid, a more lenient legal framework and better access to raw materials in competitor countries.3
- 3
OECD (2025). «Steel Outlook 2025».
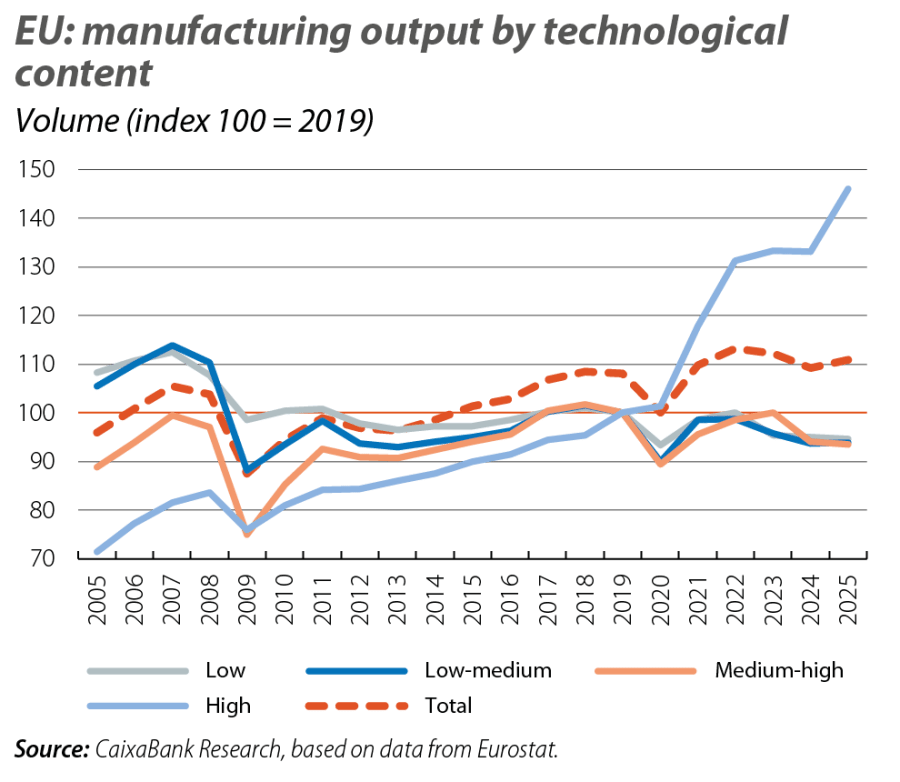
Even more concerning is the prolonged stagnation of medium-high technology manufacturing (chemicals, machinery and transport equipment, including the automotive sector), which represent the core of traditional European industry and account for a significant portion of the sector’s employment. In contrast, high-tech manufacturing (pharmaceuticals, electronics and aeronautics) has performed much better, with average annual production growth exceeding 3% over the last 20 years. As a result, its share of total industrial output has doubled (reaching 17% in 2025).
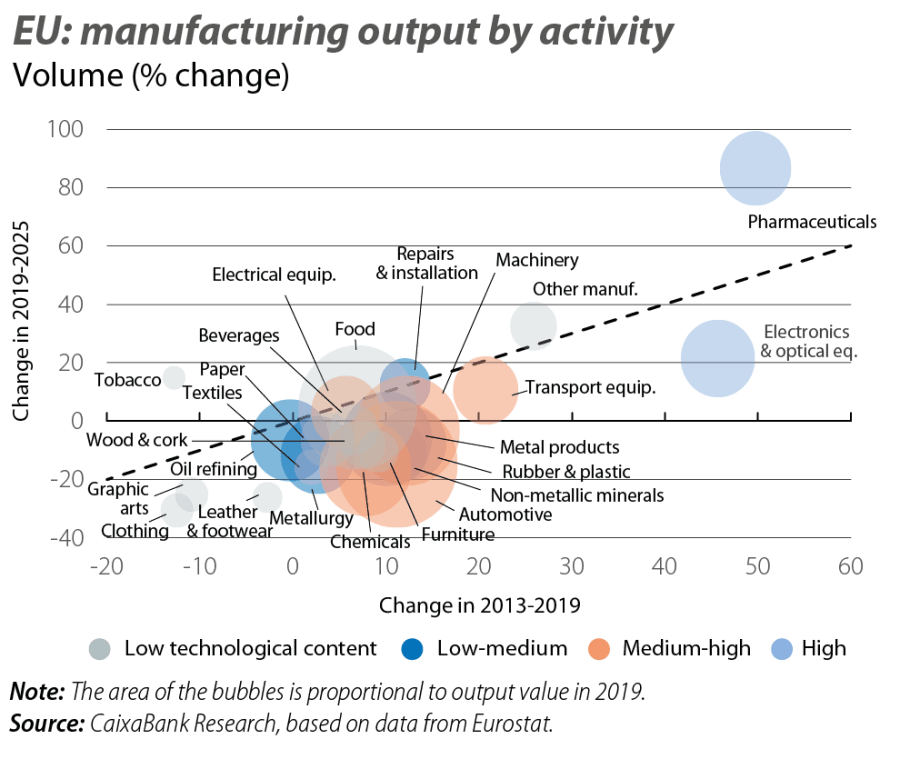
This contrasting picture by technological content becomes even more patent when analysing the pattern by industrial activity: the advances of a few have failed to galvanise a broader improvement in manufacturing as a whole (see second chart). In most cases, even before COVID-19 (2013-2019), growth was insufficient to recover the losses accumulated in previous crises, and since 2020, sharper declines or incomplete recoveries have prevailed. For example, sectors such as furniture, rubber and plastic, non-metallic minerals (mainly construction materials), chemical products and the automotive sector have shifted from growing at average rates of 1.5%-2% annually before the pandemic to declining by around 2% up until 2025. In all cases, they remain below the production levels of 10 years ago (in some cases, 20 years ago).
The automotive and high-tech sectors: two distinct geographical patterns
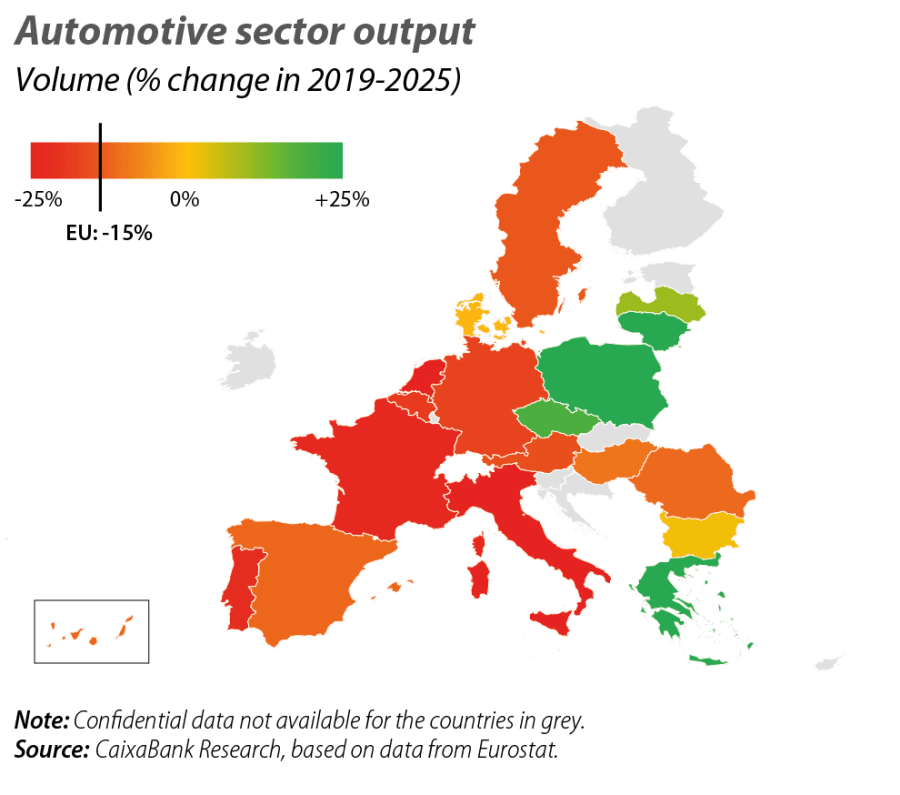
The automotive industry – one of the worst-performing industrial sectors in recent years – reveals one of the clearest territorial divides within European industry. The overall decline in production between 2019 and 2025 has not been uniform: several Eastern European countries show relatively more favourable patterns, while the large industrial economies such as Germany and Italy have recorded sharper declines (see third chart). This pattern reflects a highly pronounced production specialisation in countries such as Poland and the Czech Republic, as well as their deep integration into Central European value chains, where the automotive industry continues to play a significant role. The core countries, in contrast, have been more sharply affected by the loss of competitiveness and the adjustments resulting from the technological transition and regulatory changes associated with decarbonisation.4
- 4
See McKinsey & Company (2025). «A new ‘ERA’: an action plan for the European automotive industry».
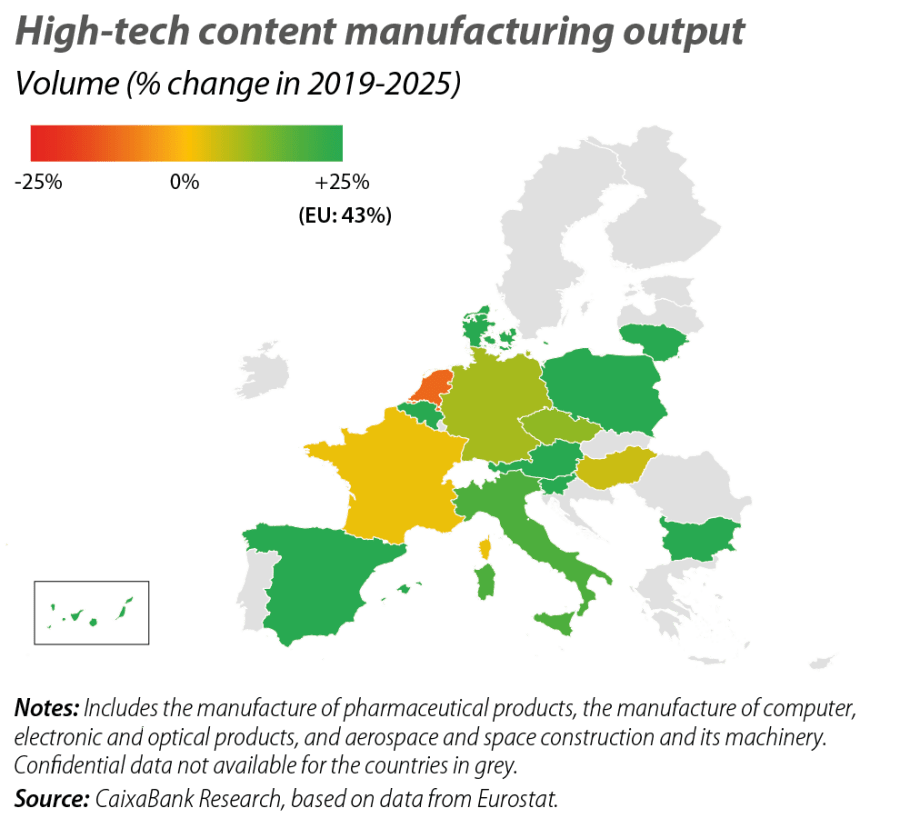
Unlike the automotive sector, the pattern in high-tech manufacturing shows less geographical divergence. Production growth has been relatively widespread across different countries, consistent with its strong aggregate performance over the past 20 years (see fourth chart). Nevertheless, the intensity of this growth is uneven, with the strongest performance found in segments such as pharmaceuticals, which has driven economies like Ireland and Denmark.5 In contrast, leading EU countries like Germany and France have recorded more modest progress, and electronic equipment manufacturing has experienced a widespread loss of momentum, precisely in the midst of the AI boom.6
- 5
See the Focus «Characterisation of the business cycle in the EU: neither widespread, nor robust» in the MR01/2026.
- 6
See the article «Differentiated strategies for governing AI: towards cooperation or conflict?» in the Dossier of this same Monthly Report.
External dependencies and limits of European industrial integration
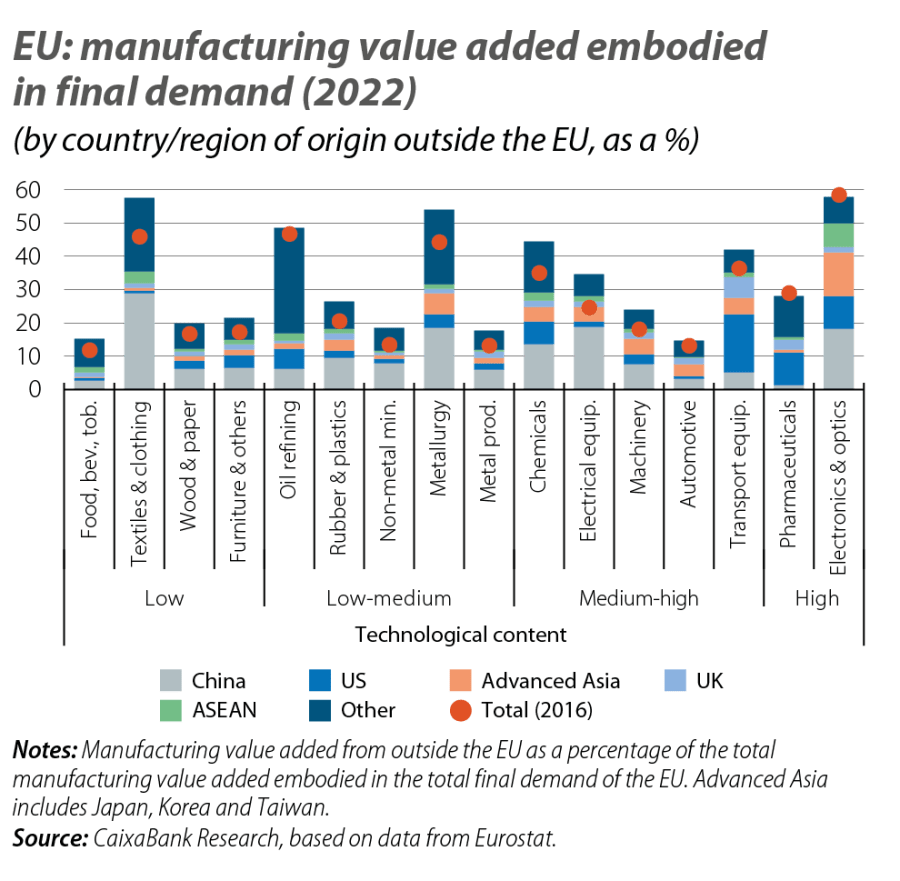
The breakdown of the EU’s final demand by origin of manufacturing value added, based on the OECD’s TiVA (Trade in Value-Added) database, provides a snapshot of European industry’s external dependencies. Although this information is published with a certain time lag (the most recent available year is 2022), the patterns that emerge are clearly structural.7 The comparison with 2016 – the midpoint of the 2013-2019 period – confirms that most manufacturing activities, including those with a high technological content, already incorporated a very high share of value added from outside the EU, with China as the main source. Moreover, in many cases these percentages had increased by 2022 (see fifth chart). This dependency is observed in all the major EU economies (especially in production chains centred in Germany) and is more intense in highly globalised industries. For instance, electronics and optical equipment, as well as textiles and clothing, have a particularly high external dependency: in both segments, around 60% of the value added in the EU’s final demand is contributed by non-EU suppliers (with China contributing approximately 20 and 30 points, respectively).
- 7
See R. Marschinski and D. Martínez-Turégano (2020) «The EU’s shrinking share in global manufacturing: a value chain decomposition analysis», National Institute Economic Review, nº 252.
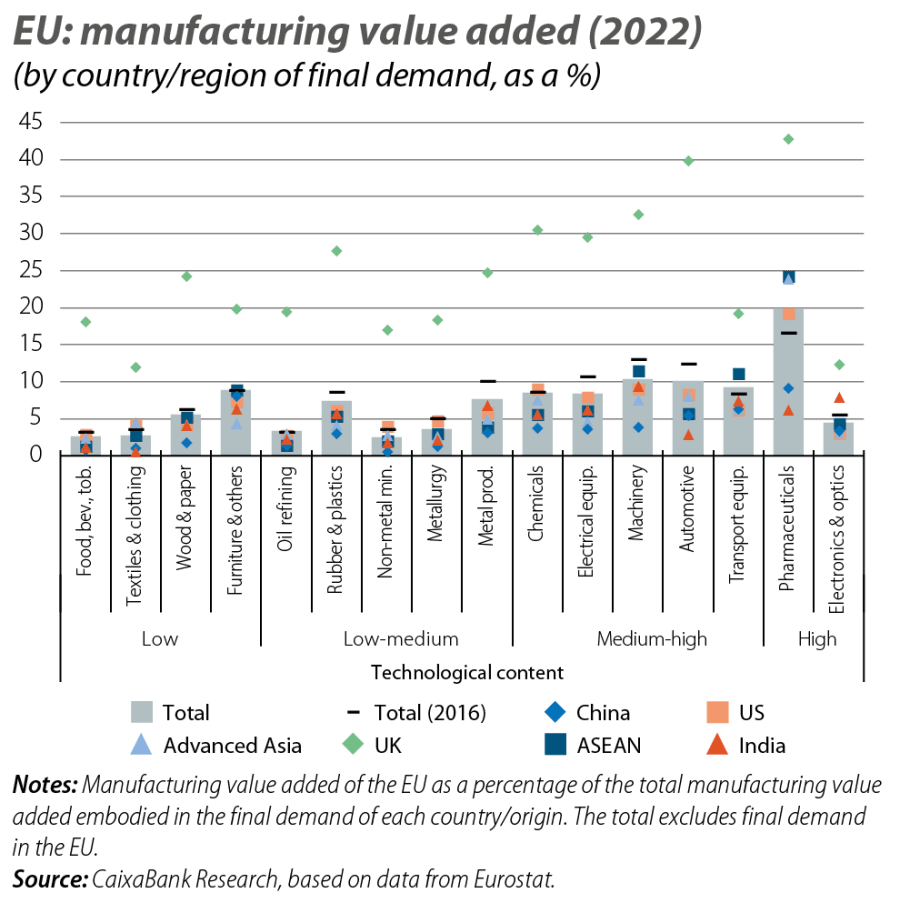
The alternative reading, based on the destination of European manufacturing value added, reinforces this asymmetry. The EU’s integration into global value chains is largely focused on advanced markets, particularly the US in absolute terms and the UK in relative terms, while its presence in Asia’s final manufacturing demand is comparatively limited (see sixth chart). For example, of the total industrial value added embodied in China’s final demand in 2022, the EU accounted for less than 3%, highlighting the challenge of gaining a foothold in Asian markets. Overall, Europe’s share of manufacturing value added embodied in the final demand of the rest of the world stood below 7% in 2022, almost 1 percentage point less than in 2016.
The diagnosis that emerges is clear and unflattering. European industry faces a structural weakness that cannot be explained solely by recent shocks nor corrected through aggregate quantitative targets. There are technological capabilities and niches of strength, but their reach is limited and their capacity to benefit other manufacturing activities is insufficient. At the same time, asymmetric international integration has increased external dependencies in key sectors, amplifying vulnerabilities in an increasingly fragmented geopolitical environment. The reform agenda kick-started with the Competitiveness Compass, which encompasses the Industrial Acceleration Act, will only be effective if it directly addresses the bottlenecks in investment, scale, and the internal market that have been hindering European industry for years. Otherwise, we risk pursuing a strategy that, while well-intentioned, is incapable of reversing deeply-entrenched trends.
Geopolitics
We analyse the major geopolitical trends and thier effects on the financial markets and the economy.