An uncertain energy shock hangs over the global economy
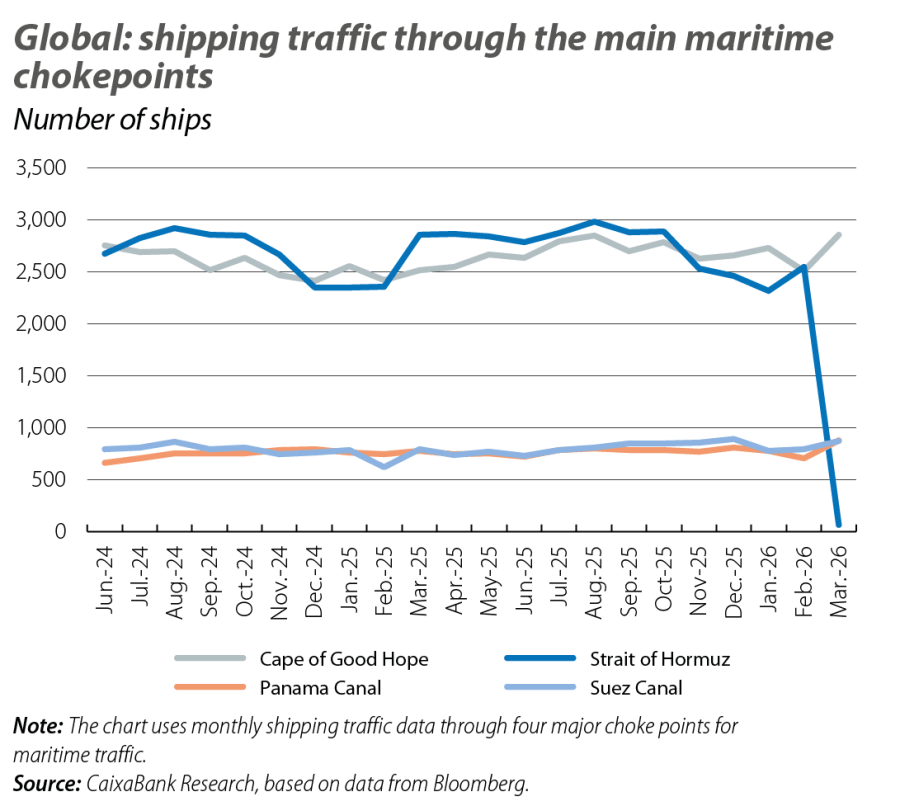
Faced with the biggest oil shock in decades, the global economy is bracing for the consequences of the closure of the Strait of Hormuz, through which around 20% of the oil and LNG produced and consumed globally passes. The March data point to a sharper deterioration in services, the US economy is no longer booming, and inflation notes the first impact of rising energy costs. In Asia, the economies started the year under the same moon: Japanese strength, Chinese solidity and rising prices.
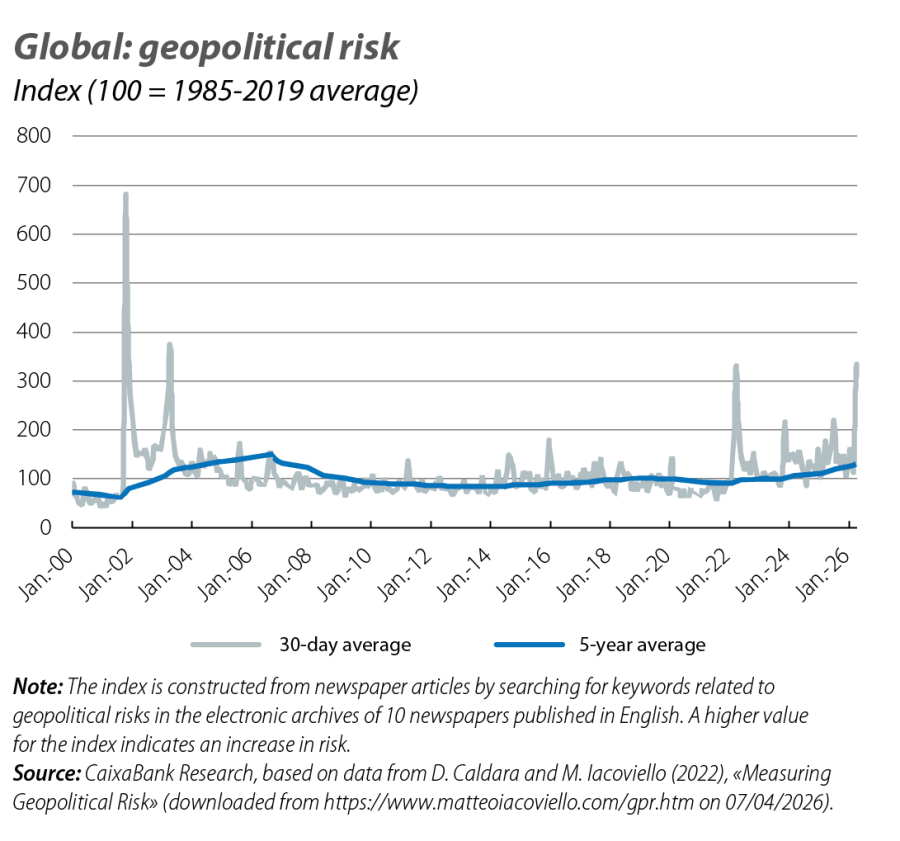
A new global shock, with coordinates yet to be defined
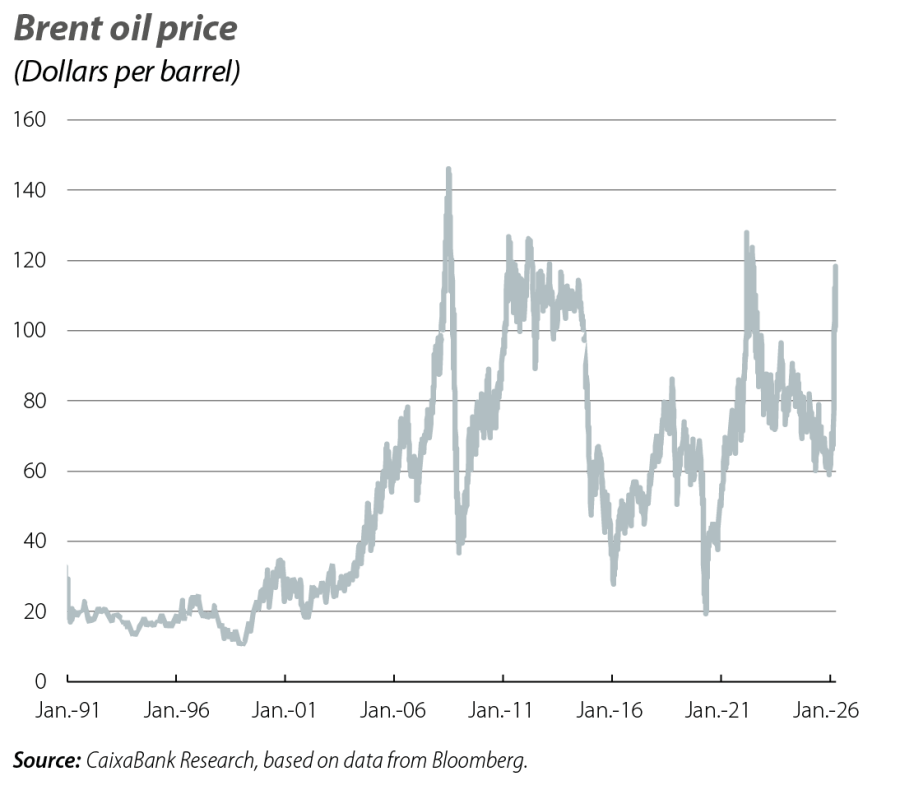
Faced with the largest oil shock in decades, the global economy is bracing for the consequences of the closure of the Strait of Hormuz, through which around 20% of the oil and LNG produced and consumed globally flows. Throughout March, the conflict was characterised by heightened volatility in the financial markets, most notably in energy markets (see the Financial Markets - Economic Outlook section). Despite the uncertainty over two key variables – namely, the duration of the conflict and the extent of damage to key infrastructure – the price of Brent was close to 100 dollars per barrel (around 70 dollars in February), while futures prices for delivery through to the year end exceeded 80 dollars. On the gas side, prices were above 50 euros per MWh in contracts until next winter. These prices are compatible with scenarios involving a short-lived conflict and limited damage to productive capacity in the Gulf region, albeit with a long tail of downside risks.
The March data point to a sharper deterioration in services
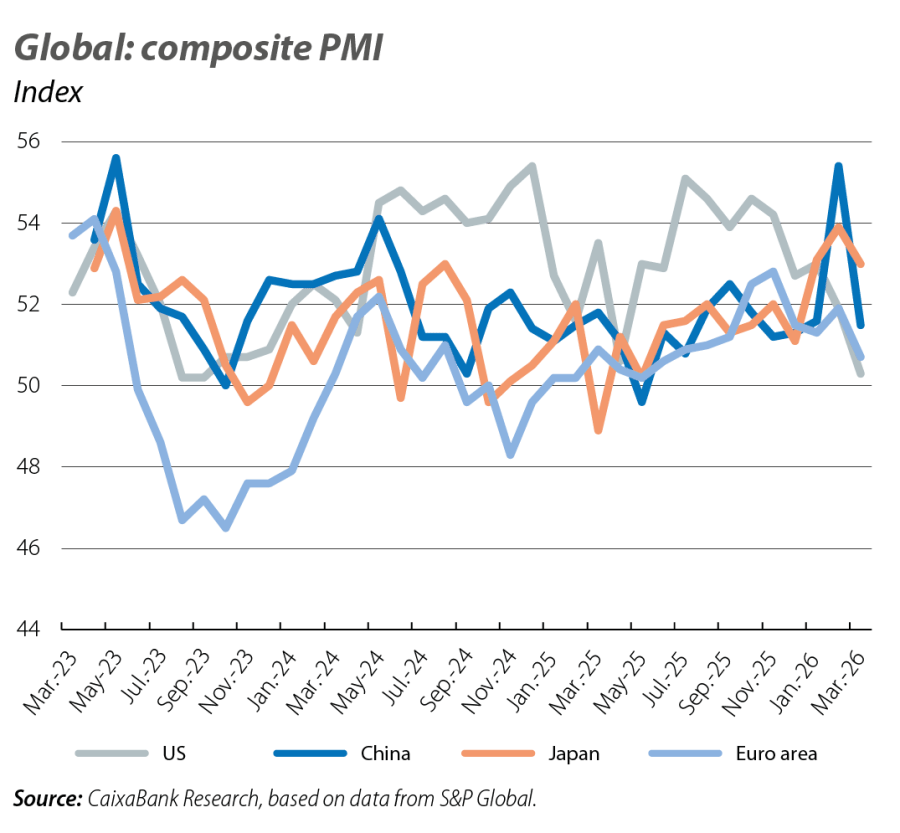
The euro area PMIs show mixed patterns in March. The services index fell to 50.2 points (vs. 51.9 previously) and that of manufacturing rose to 51.6 points (vs. 50.8 previously). The price subcomponents indicate a rise in input costs that is not yet being passed on to final prices. By country, France was in contractionary territory (48.8 points vs. 49.9 previously), while Germany remained in the expansionary zone, although it also shows a significant decline (51.9 points vs. 53.2 previously). The main German business confidence indices confirm the deterioration in sentiment in March. The Ifo fell by 2.0 points (to 86.4, below the 100-point benchmark), due to the sharp decline in the expectation component, while the ZEW index shows that the percentage of respondents anticipating a deterioration in activity rose sharply this month. In the US, the services PMI also recorded a decline (49.8 points vs. 51.7 previously) and the manufacturing PMI rebounded (52.3 points vs. 51.6 previously) thanks to increased dynamism in production and new orders. The US PMI also indicates a sharp rise in production costs and a rapid pass-through to final prices, with this subcomponent recording its most pronounced increase since 2022.
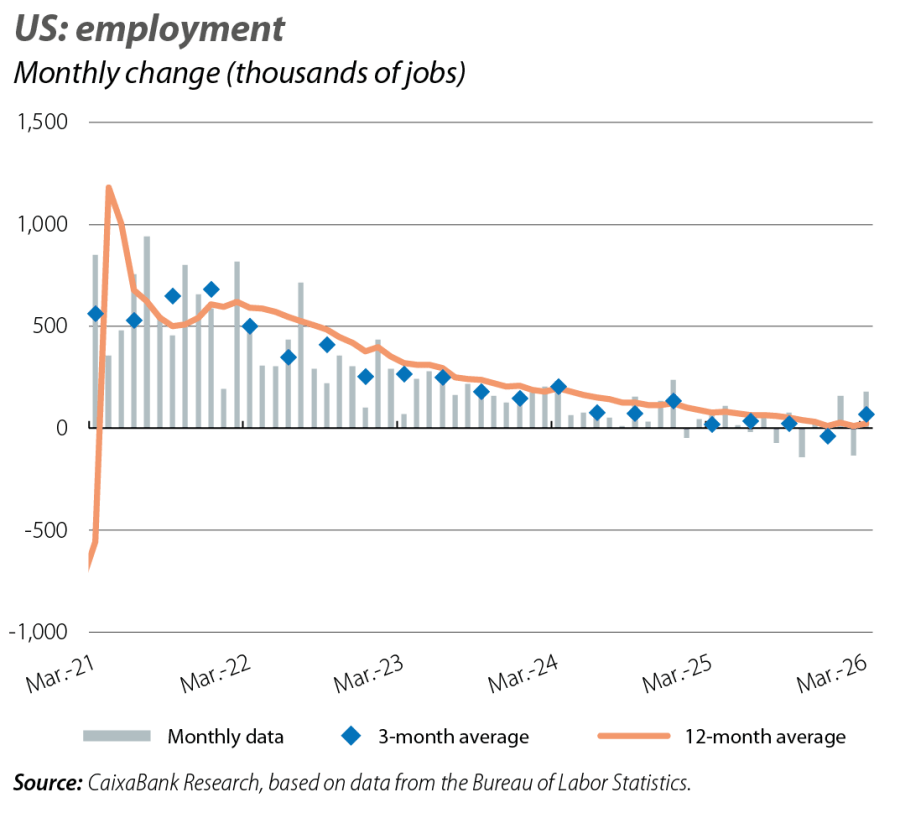
The US economy comes back down to Earth
The second estimate of the Q4 2025 GDP figure placed its quarter-on-quarter growth at 0.2%, compared to 0.4% in the first estimate, leaving its average growth in 2025 at 2.1% (vs. the previous 2.2%). In particular, the quarter-on-quarter growth of public consumption was revised downwards to –1.5% (–0.2 pps), reflecting that the federal government shutdown had a greater impact than expected. Private consumption and investment also experienced slight downward revisions, but maintained dynamic growth rates. On the other hand, the sharp increase in employment in March (+178,000 jobs) is mainly explained by temporary effects, such as the reversal of strike effects and milder weather, rather than by any structural upturn in the labour market. The biggest increases were in sectors such as healthcare, construction, leisure and manufacturing, while the declines continued in technology, information and financial services. Average job creation in the US, meanwhile, stood at 68,300 jobs in Q1, with a recent trend indicating a practically stagnant labour market.
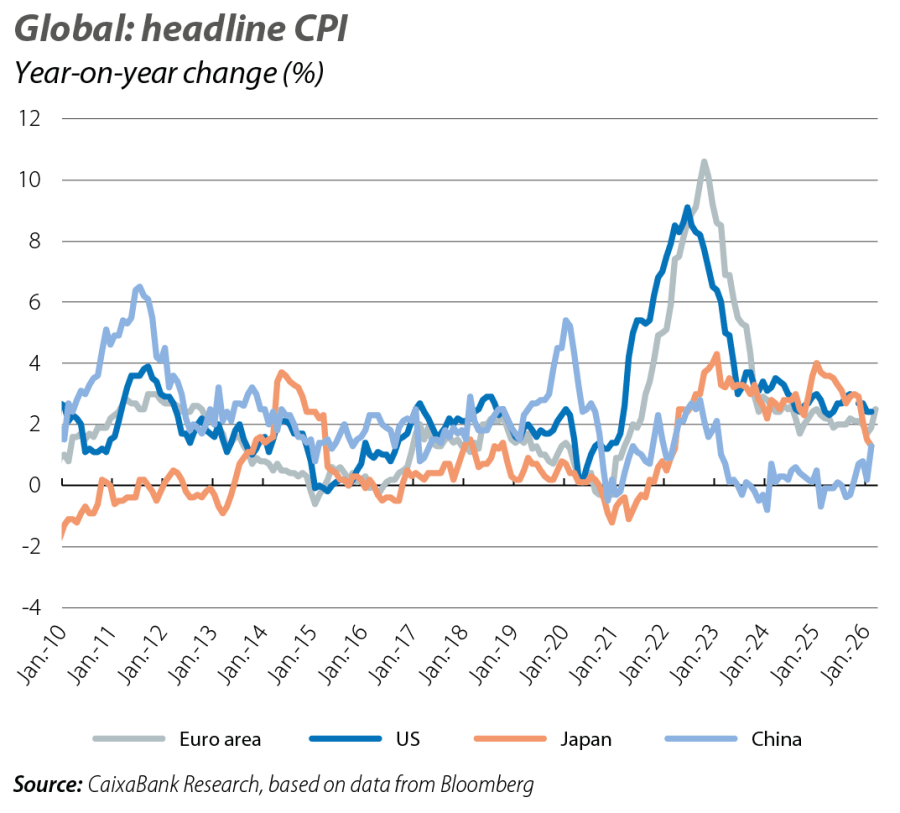
Inflation notes the first impact of rising energy costs
Amid rising energy prices, headline inflation in the euro area increased by 0.6 percentage points in March to 2.5%, while core inflation (which excludes food and energy) fell to 2.3% (vs. 2.4% previously). The energy component has shifted from a 3% year-on-year decline in February to a 5% year-on-year increase in March. In contrast, price pressures eased in the rest of the consumer basket, particularly in services, where inflation returned to 3.2% year-on-year following the rebound in February. These figures reflect favourable dynamics prior to the conflict in the Middle East, although in the future they could be affected by rising energy costs, as well as the key question for the ECB of whether this increase will spread to the rest of the basket. In the US, inflation remained stable in February: 2.4% year-on-year in headline inflation and 2.5% in the core index, the same as in January. On the other hand, the private consumption deflator shows underlying inflation still above 3%, while the producer price index rose by 0.5 pps in February to 3.4%. These inflationary pressures are more intense than in the euro area and could imply a more cautious trajectory than anticipated on the part of the Fed.
Asian economies start the year under the same moon: Japanese strength, Chinese solidity and rising prices
In Japan, the Tankan survey showed positive dynamics in Q1. The business conditions index for large manufacturers rose from 16 to 17, close to its 18-point peak reached in 2021. In the non-manufacturing sector, the index remained at 36, its highest level since the 1990s. On the other hand, price indices among large manufacturers increased, although they remain far from the levels recorded in recent years. In China, the economy accelerated in Q1, mainly due to the boost from exports. Industrial production grew by 6.3% year-on-year in January and February (vs. 5.2% in December), while retail sales recovered (2.8% year-on-year vs. 0.9% in December) and fixed investment in urban areas returned to positive territory, albeit still at very contained levels. In this context, the official manufacturing PMI rose from 49.0 to 50.4 points in March, while the RatingDog PMI, whose sample includes companies that are relatively more exposed to foreign markets, fell from 52.1 to 50.8 points. However, price pressures spiked sharply. The input prices subcomponent surged from 54.3 to 60.5 points, while the selling prices subcomponent stood at 53.8 points, a four-year high. On the services side, the official PMI rose from 49.7 to 50.1 points, a sign confirming that Chinese households might be less affected by the rise in global energy prices, in an environment of low inflation and regulated prices.