
Scale, integration and value: the challenges facing Spain’s agrifood cooperative sector
Cooperatives play a crucial role in the competitiveness of a sector as fragmented as the agrifood industry. By consolidating supply, sharing investments and services and facilitating access to markets, cooperatives strengthen the position of farmers and livestock producers in the food chain. However, their prevalence and economic strength vary considerably across regions and production sectors. The benefits associated with scale are fully realised when accompanied by strategies geared towards differentiation, innovation, industrial transformation and closer links with consumers. In this context, the challenge facing Spain’s agrifood cooperative sector is not only to continue scaling up, but also to strengthen its ability to generate added value and increase its market power.

A profile of the average agrifood cooperative in Spain
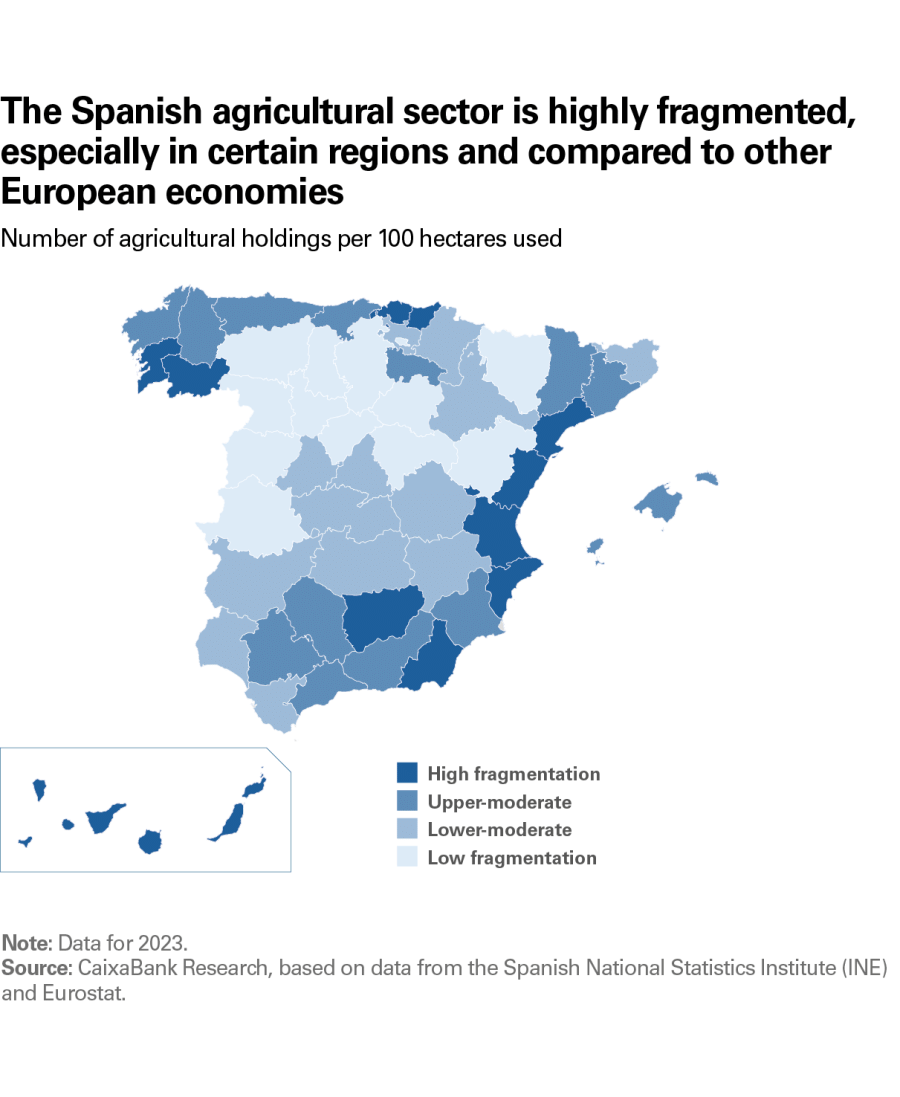
The cooperative model plays a particularly important role in countries such as Spain, where agricultural production is more fragmented. Spain ranks among the major agricultural economies with the highest level of production fragmentation, only surpassed by Italy, although it is below the EU average (countries like Romania, Greece and Slovenia, among others, raise the region’s average). As shown in the following map, significant regional differences exist in the level of fragmentation, with a higher density of farms per hectare of utilised agricultural area in the north-west, some southern provinces, and parts of the Mediterranean arc.
Through cooperatives, farmers and livestock producers join forces to market their production jointly, share services and investments, and access markets on better terms. This enables them to strengthen their negotiating power and increase the profitability of their farms, while also contributing to the economic development of rural areas. So, what characteristics define Spain’s agrifood cooperative sector?
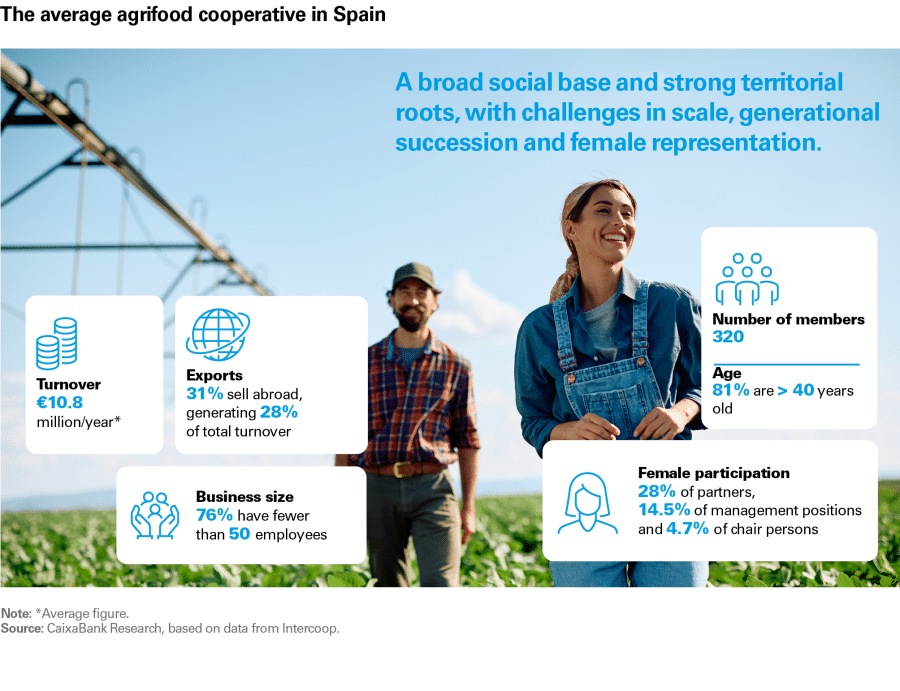
The average Spanish agrifood cooperative is a small company: 76% employ fewer than 50 workers. It invoices an average of around 10.8 million euros per year and comprises approximately 320 members, mainly farmers and livestock breeders. Additionally, a significant portion is notably export-oriented: 31% of cooperatives sell abroad, generating 28% of their revenue. Its membership base remains predominantly male – women account for 28% of members, 14.5% of management positions and just 4.7% of chair persons – and it is ageing, with participation of young people under 40 years old sitting at around 9%. Ultimately, these figures reflect a business model with a broad social base, strong local roots and significant challenges in terms of scale and generational succession.7
- 7
The figures used in this article are sourced from the Ministry of Agriculture, Fisheries and Food (MAPA) and the Socioeconomic Observatory of Spanish Agrifood Cooperatives (OSCAE), with the latest available information dating from 2023. These sources place the number of agrifood cooperatives in Spain at 3,669 and estimate a combined turnover of 39.57 billion euros (44.7 billion if associated companies are included). However, it should be noted that the number of cooperatives recorded in these statistics has remained stable since 2018, while the records published by the Ministry of Labour and Social Economy (MITES) indicate that an additional 481 agricultural cooperatives were established between 2019 and 2025.
A business model with a broad social base, strong local roots and significant challenges in terms of scale and generational succession
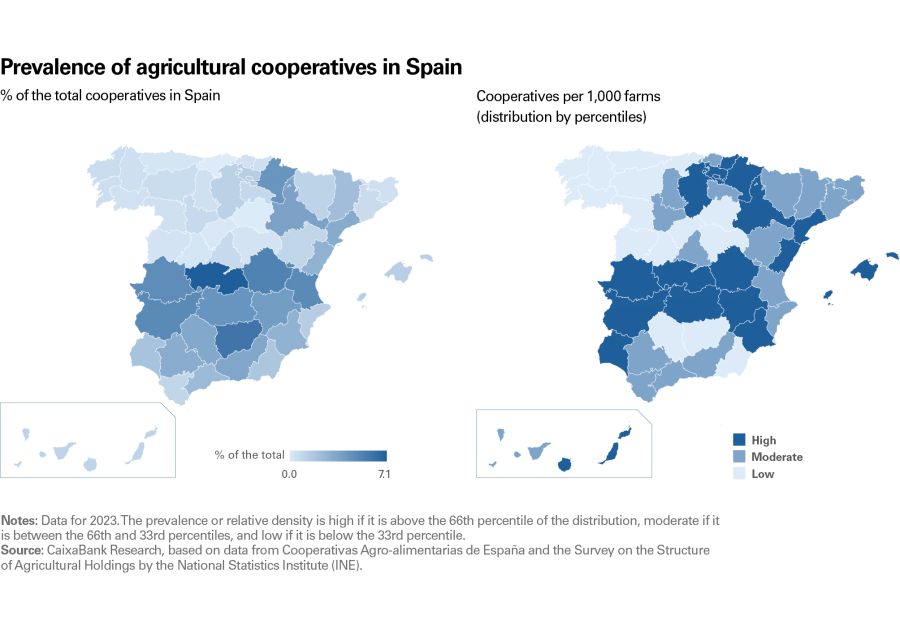
Agrifood cooperatives are highly geographically concentrated
The geographical distribution of agricultural cooperatives is very uneven, as shown on the map on the left of the next page. Their presence is particularly notable in the south and in the interior of mainland Spain, with Andalusia and Castilla-La Mancha being the main focal areas. In total, 75% of cooperatives are located in just six autonomous communities: Andalusia, Castile and León, Castile-La Mancha, the Valencian Community, Catalonia and Extremadura.
The map on the right of the next page provides a complementary perspective by relating the number of cooperatives to the number of agricultural holdings in each province. This indicator offers an approximation of the density or relative prevalence of cooperatives in the area. The highest levels are observed in large swathes of the southern interior of the mainland, especially in Extremadura, Castilla-La Mancha and some provinces of the Ebro Valley. In contrast, much of northern Spain shows a lower ratio of cooperatives per farm, indicating a relatively lower presence of cooperative entities.
Overall, the results suggest that Spain’s agricultural cooperative sector has taken stronger root in regions where the need to consolidate supply, make joint investments and strengthen producers’ bargaining power has encouraged the development of cooperative structures, particularly in activities such as olive oil, wine, or certain branches of livestock farming. Nevertheless, their prevalence is also influenced by the productive structure, farm size and historical trends in agricultural associations.8
- 8
This aggregate analysis of Spanish agricultural cooperatives should be treated as an approximation: it does not include the number of members, turnover, marketed production, or the multi-sector and inter-regional nature of some cooperatives. Therefore, it cannot be concluded from this analysis alone that greater concentration necessarily implies cooperatives with larger economic scale or greater market power.
The cooperative model varies greatly depending on the agricultural sector
Spain’s agrifood cooperatives do not follow a uniform pattern. The table on the next page provides an insight into this variety based on four different dimensions. Firstly, the distribution of cooperatives across agricultural sectors reveals where the bulk of Spain’s cooperative network is concentrated. Secondly, the number of cooperatives per 1,000 farms indicates the relative density or prevalence of cooperatives. Thirdly, the average turnover per cooperative provides a measure of their business size. Finally, the ratio between cooperatives’ income and the value of agricultural production provides an estimate of their economic penetration, that is, the actual weight of cooperatives within each sector.9
A notable feature is the high concentration of cooperatives in a few activities. Olive oil accounts for a quarter of all Spanish agrifood cooperatives (25.3%), followed by fruit and vegetables (13.6%), wine (12.4%), and arable crops (11.6%). Together, these four branches account for nearly two-thirds of all Spanish agrifood cooperatives, reflecting the long-standing associative tradition of much of Mediterranean and extensive agriculture.
Within this group, herbaceous crops show a particularly high prevalence of cooperatives, although they are less significant in terms of economic scale. With 15.2 cooperatives per 1,000 farms, they have one of the highest organisational densities in the sector, although the average turnover is just 3.6 million euros per entity. A similar pattern is observed in nuts, beekeeping and flowers and plants, where a strong presence of cooperatives coexists with small-sized organisations.
Activities that combine a significant presence of cooperatives with high economic penetration also stand out. The most representative example is olive oil, which not only accounts for one in four cooperatives but also generates income equivalent to 2.4 times the value of agricultural production. Fruits and vegetables, wine and table olives are also noteworthy sectors where cooperatives play a central role in marketing and organising supply.10
In contrast, some activities have few cooperatives, but they are large in business scale. This is the case for milk and dairy products, white pork, Iberian pork and egg-laying poultry, which show some of the highest average turnover figures. This pattern suggests more advanced integration and consolidation processes.
Overall, the results highlight the coexistence of different cooperative models: one that is typical of much Mediterranean agriculture, where cooperatives are numerous and play a central role in processing and marketing; another that is more concentrated and business-oriented, mainly associated with certain intensive livestock sectors; and a third group with a strong territorial presence but smaller entities.
- 9
Cooperatives providing cross-sector services (supplies, services, agricultural stores, shared machinery, and other ancillary activities) and collective farming cooperatives are not included. Since these entities operate simultaneously across multiple agricultural products, their inclusion would complicate the comparative analysis by sector. Supply-focused cooperatives deserve a special mention, as there are over 1,000 such entities in Spain and they represent a major part of the agrifood cooperative sector.
- 10
The income of cooperatives reflects the value of sales made by these entities and not solely the value of their members’ primary agricultural production. In several sectors, cooperatives engage in activities such as conditioning, industrial processing, marketing and distribution, which increase the product’s value throughout the chain. Additionally, turnover may include transactions involving products purchased from third parties. As a result, the average income per cooperative can exceed the value of agricultural production in the sector in question and surpass the value of 1 in the fourth column of the table.
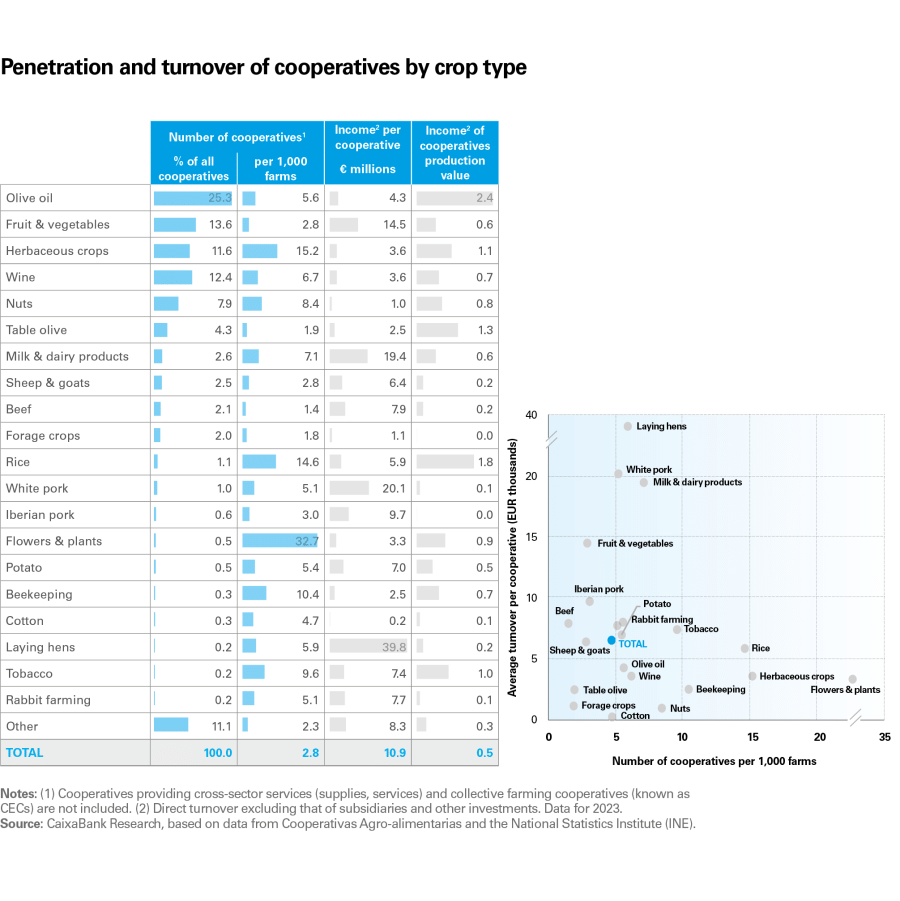
The scatter plot on the previous page reinforces this idea by showing that a greater relative presence of cooperatives does not necessarily mean a larger business size. Sectors such as flowers and plants, nuts, beekeeping and herbaceous crops have a high density of cooperatives but low average turnover. In contrast, fruits and vegetables, milk and dairy products, white pork and egg-laying poultry show that the key to generating economies of scale lies not so much in the number of cooperatives but rather in their level of integration and economic scale.
Cooperatives are upscaling, but there are other recipes for success
Although the structure of Spanish agricultural cooperatives remains highly fragmented – with micro-cooperatives and small cooperatives accounting for 39% and 37% of the total, respectively, in 2024 – economic activity has gradually shifted towards larger entities. Large cooperatives have increased their share of turnover from 40% in 2014 to 60% in 2024 and have grown their share of the total number of entities from 2% to 6%.
However, achieving scale is not only accomplished through consolidations that result in fewer but larger cooperatives. Other models are also emerging, such as the increase in second-tier cooperatives, commercial alliances, joint marketing platforms, and purchasing and logistics centres.
Average size of agrifood cooperatives
Business size is a necessary condition to strengthen producers’ positions in the food chain, but on its own it is not enough. Negotiating power depends not only on consolidating supply but also on the ability to differentiate products, anticipate market trends and retain a larger share of the value generated throughout the chain. The most successful cooperatives are those able to combine the advantages of scale with strategies aimed at reducing the substitutability of their products and making advances in the value chain. Differentiation through brands, designations of origin, quality certifications, or sustainability attributes offers a partial escape from competition based solely on prices. Meanwhile, industrial processing, packaging and direct marketing allow producers to have a greater share in the final value of food products.
Information and the coordination of supply increasingly represent competitive advantages in agricultural markets that are characterised by volatility and informational asymmetries. Having a better understanding of demand and consumption trends, along with joint planning of production and marketing, helps reduce market imbalances and strengthens producers’ negotiating power. Overall, the experience of Europe’s most successful cooperative models suggests that their competitive advantage lies not only in the concentration of supply, but in their ability to transform the achieved scale into innovation, brand development, internationalisation and value creation.