
What do high-frequency data tell us about rents in Spain?
This article analyses the recent dynamics in Spain’s rental market based on internal CaixaBank data on direct debit payments for residential rents. According to our indicators, annual rent price increases are moderate when there is no change of tenant or landlord, generally lying below 3% and close to inflation, and consistent with regulatory caps. In contrast, the pressure on the price of new rental contracts has increased, closing 2025 with growth in excess of 10% year-on-year. Despite this, the median cost burden remains stable at around 30%, although there is still significant inequality between age groups and greater pressure in large cities.
In the last two decades, the proportion of the population that rents their dwelling6 has increased significantly in Spain. Whereas in 2007 only 19.4% of the population lived in a home that was not their own, by 2024 this figure had risen to 26.3%. This change implies a partial convergence towards the levels observed in the EU, where in 2024, 31.6% of the population lived in rented accommodation.
In this article, we analyse the dynamics of rents in Spain using internal CaixaBank data on rent payments, duly anonymised and aggregated. We analyse the payer-issuer relationships by distinguishing between new rental contracts and existing contracts with rental price updates, allowing trend shifts to be captured more precisely. Using this information, we construct rental price indicators. This approach allows us to complement traditional data sources with high-frequency and granular measures.
- 6
A tenant is defined as anyone who does not live in a property which they own.
Rents for repeated leases have grown at close to inflation
When analysing the year-on-year change in repeated rents – those where the contractual relationship remains constant (same tenant and landlord) – moderate increases are observed, generally close to inflation.7
The median growth of updated rents remains below 3% in all months between January 2018 and December 2025, reflecting the effect of regulatory limits applied during different periods. During the freeze on rent increases in force during the pandemic, the median was 0%. More recently, it has stabilised at around 2.3%, in line with the current limit for contracts updated according to the housing rent update reference index (IRAV).8
In parallel, the 75th percentile is around 2.9%, consistent with the maximum caps applicable to contracts linked to the CPI.
In contrast, the 90th percentile shows significantly higher increases, suggesting the presence of specific situations, such as contract renewals or improvement works on flats, where higher increases can occur.
- 7
This analysis focuses on rents paid by direct debit, it does not include those paid by transfer or other payment methods. As a result, the sample may be partially biased towards contracts managed by real estate companies rather than individual landlords.
- 8
The housing rent update index (IRAV) establishes a formula which sets the upper limit for annual updates to housing lease contracts for rental agreements signed from 26 May 2023 onwards. For contracts signed prior to this date, the price adjustment clause agreed in the contract applies, generally linked to the CPI.
The pressure on the price of new rentals is increasing
The analysis compares the price of new rental contracts9 in a given month with that of new contracts signed in the same month of the previous year.10 Note that, by definition, this does not compare the same rental contracts, as in the case of repeated rents; rather, it analyzes the evolution of the price of the set of new leases signed in the reference month.
Following episodes of negative growth at the end of 2019 and at the start of the pandemic, prices of newly signed rental contracts have picked up sharply. From 2024, the increases are clearly above inflation, and in the final months of 2025 both the average and the median year-on-year growth rates have exceeded 10%.
- 9
A contract is considered new during the first six months it is observed in our data.
- 10
There is no information available on the characteristics of the homes, so the comparison may be capturing differences in the characteristics of the properties (e.g. size, location or quality), in addition to real price changes.
The median rental cost burden remains stable
A crucial aspect to consider in the rental market analysis is the cost burden11, which measures the percentage of household income12 that is dedicated to paying rent. This metric shows considerable stability.
The median of the set of contracts is around 30% for the entire sample.
However, in approximately 30% of contracts, the burden surpasses 40% (a threshold widely considered excessive), and this proportion changes very little over time.
One factor that may contribute to the stability we observe in the rental cost burden is residential mobility. When faced with contract renewals, some tenants move to a different property in order to maintain a similar level of expenditure, even if it means adjusting to a property with different characteristics (in terms of size, location or quality).
- 11
The cost burden indicators have been validated with other public information sources. Nevertheless, they should be interpreted with caution, especially the values in the tails of the distribution, due to potential measurement issues – e.g. it is possible that the total income of households operating with more than one bank may not be observed, or that there could be cases such as shared rentals that may cause distortions.
- 12
Income includes wages, unemployment benefits, pensions or other professional incomes of the members of each household. See the CaixaBank Research Real-Time Economics Portal for more information.
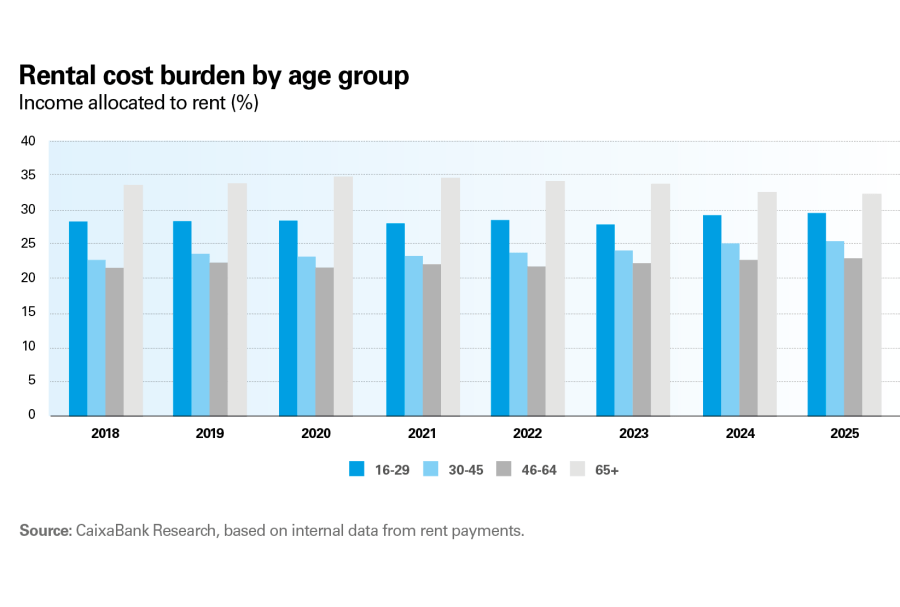
The rental cost burden is uneven across age groups
When breaking down the rental cost burden by age, we see a marked heterogeneity and differentiated dynamics can be observed depending on the point in the life cycle.
Young people and seniors exhibit the highest median levels of cost burden. However, between 2020 and 2025 the burden among seniors decreases by 1.4 pps, while among young people it increases by 1.1 pp in the same period.
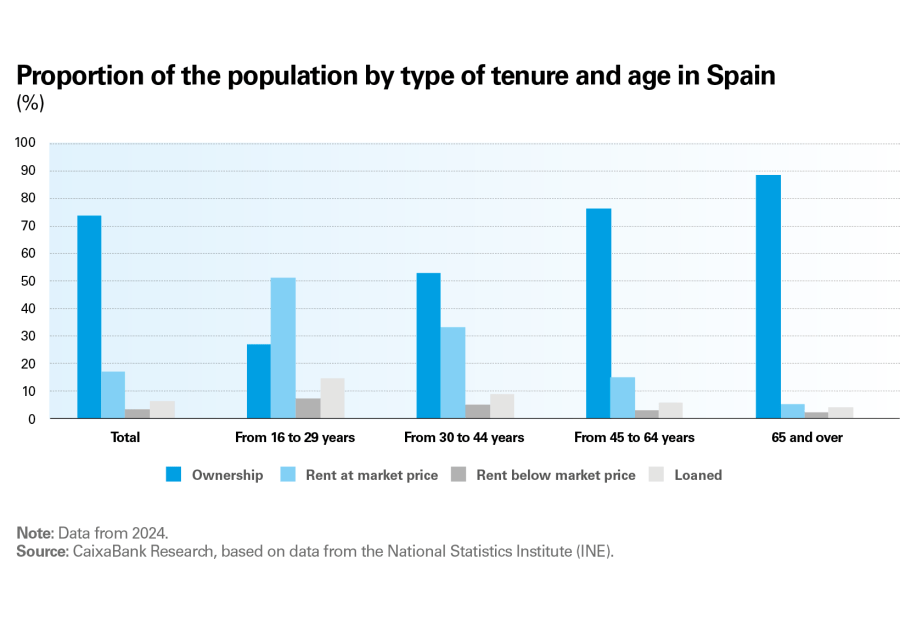
The increase in the rent burden for the young population is particularly significant, since housing tenure is closely linked to the stage of the life cycle. Younger people tend to rent (or live in rent-free housing), whereas, as age increases, the proportion of homeowners rises sharply, reaching close to 90% among people over the age of 65.
In contrast, middle-aged cohorts show more restrained cost burdens, generally between 20% and 25%. Even so, the 30 to 45 age group accounts for the largest cumulative increase: +2.7 pps since 2018.
The rental cost burden is greater in large municipalities
The rental cost burden shows significant geographical differences, both among the set of ongoing contracts and in the case of recently signed contracts.
In large cities, defined in the sample as municipalities with more than 300,000 inhabitants, the median burden is around 35%, and for new contracts it reaches between 35% and 40%, close to the threshold of excessive burden.
In smaller municipalities, the burden is lower, generally between 25% and 30%. Even so, in these areas as well, new rentals require a greater effort than existing contracts and stand at around 30%.
In conclusion, although the median rent burden remains stable, the rental cost burden is high for young and older people in new contracts and, especially, in large cities. These results highlight the need to expand the housing supply in Spain and to do so in a way that focuses on improving affordability in the most strained segments. An increase in supply with this perspective would help alleviate rental market bottlenecks and reduce their impact on key life cycle decisions – such as education, labour mobility or starting a family – particularly among the most affected groups.
Real-Time Economics
Follow the evolution of the Spanish economy with our real-time indicators and our published articles.