Is technology and complexity exported from Spain?
Geopolitical tensions and the uncertainty surrounding foreign demand force us to reassess the strengths and weaknesses of exports in the Spanish economy. To do so, it is essential to analyse what we export, how diversified our range of products is, as well as how competitive it is. To improve our understanding, in this article we will analyse the complexity of the products that are exported, as well as their technological intensity, two key variables for assessing the competitiveness of our exports.

A useful tool for evaluating the resilience of our exports to external shocks is economic complexity. Economic complexity is an indicator that measures the diversity and sophistication of what a country produces and exports. A country with a high economic complexity index (ECI) tends to produce many different products, especially goods that few other countries can produce, and it is an indicator of a highly knowledgeable economy. On the contrary, a low ECI means that the country exports few products and that they are generally common in nature (i.e. many other countries also produce them), reflecting lower diversity and sophistication in its production apparatus. Greater export complexity is associated with better growth prospects and greater resilience in the face of global turbulence.1,2
Like two sides of the same coin, we can also define the economic complexity of a particular product, rather than that of a country, using the product complexity index (PCI). The PCI measures a product’s sophistication based on the complexity of the countries that trade it and how many can export it. In this article, we will use both perspectives (both the ECI and the PCI).
To enrich this analysis, we also incorporate a technological perspective. To this end, we link each exported product with the economic activity that generates it using a correlation table produced by the OECD.3 This perspective allows us to answer the question: to what extent are our exports intensive in manufacturing sectors that are considered high-tech? In contrast with the ECI, the technological level of exports is determined by measuring the effort in R&D and the technology incorporated into industries. Thus, as shown, pharmaceutical and aerospace products are examples of high-tech goods, while textile products would fall into the low-tech category. This dual perspective (complexity and technological content) will allow us to paint a more in-depth picture of Spain’s foreign competitiveness.
- 1
See, for example, C.A. Hidalgo and R. Hausmann (2009). «The building blocks of economic complexity». Proceedings of the National Academy of Sciences, 106(26), 10570-10575. D. He, Y. Tang, L. Wang and M. Mohsin (2023). «Can increasing technological complexity help strengthen regional economic resilience?». Economic Change and Restructuring, 56(6), 4043-4070. And R. Hausmann et al. «The Atlas of Economic Complexity: Mapping Paths to Prosperity». The MIT Press, 2014.
- 2
See C. Canals and J. Montoriol «La complejidad de las exportaciones y la calidad del empleo», Spanish Economy Papers 158 (2018): 116, which shows that, in the case of Spain, the industries and autonomous communities with more complex exports tend to generate more stable employment.
- 3
We use the correspondence developed by the OECD between the Harmonized System (HS) for internationally traded products, in its 2012 version, and the economic activities defined in the BTDIxE database (Bilateral Trade Database by Industry and End-use category).
What are we competitive in?
In order to assess the positioning of Spanish exports, we sorted products according to three key dimensions: their complexity, our revealed competitiveness and their technological content. The Atlas of Economic Complexity4 provides detailed data on the complexity of Spanish exports (PCI) and on Spain’s market share for each product. We consider a product to be complex if its complexity index, which we rescale to take values between 0 and 100, exceeds 50 points. Also, based on the market share of exports we calculate the revealed comparative advantage, which tells us whether a country exports relatively more of a particular product compared to other countries.5 According to this metric, a country is competitive in a given product if the index is greater than 1, or 0 if we take the index logarithm, as is our case.
We show the constellation of products we export classified according to these three dimensions in the first chart. The vertical axis shows the products’ degree of complexity; the horizontal one, the revealed competitiveness, and the colour of each bubble, the technological content. Finally, the size of the bubble shows what share of Spain’s total exports each product represents.
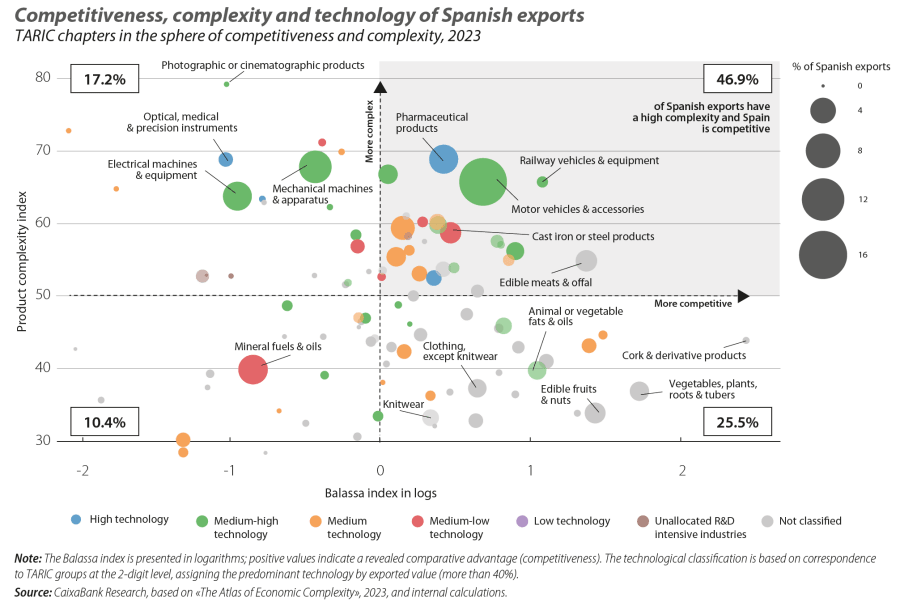
46.9% of Spanish exports correspond to highly complex products in which Spain has a clear competitive advantage. In addition, many of these products incorporate a high technological content, as can be seen in the chart, where they are represented by blue and green dots. The automotive sector is a strong point of Spanish exports. These are products with a high complexity and medium-high technological content. Exports of motor vehicles and accessories represent 16.7% of Spain’s total exports. Although it represents a smaller portion of Spanish exports, at 5.4%, the pharmaceutical sector also stands out and is associated with highly complex and high-tech products.
However, Spain is also highly competitive in exports with a low complexity and medium or low technology content, especially in the agricultural sphere,6 such as fruits and vegetables. Some products are clearly distinctive of the country, such as animal or vegetable fats and oils, which include treated oils for technical or industrial use (classified as medium-high technology).7 Cork and derivative products also stand out, with Spain accounting for 20.1% of global exports. In total, low-complexity exports in which Spain is competitive represent 25.5% of the total exported.
Also, 17.2% of Spanish exports are concentrated in highly complex products in which, however, Spain still does not have a clear competitive advantage. This group includes products that already represent a significant proportion of the total exported, indicating there is some margin for improvement in terms of competitiveness. This is the case of electrical machinery and equipment (7.2% of Spanish exports), as well as mechanical machines and apparatus (5.6%). Also of note are optical, medical and precision instruments, which are high-tech and highly complex products. These sectors, located in the upper left-hand section of the chart, represent an area with a high potential for industrial and technological development in Spain.
Thus, in Spain, 64.1% of exports in 2023 corresponded to complex products, of which 76.2% were competitive. Moreover, 10.8% of Spanish exports were related to high-tech activities.8 These figures, although positive, require context.
- 6
The classification of technological intensity does not include agricultural products.
- 7
Other types of oils are not considered technology-intensive.
- 8
These data may differ from those published by Eurostat. The difference is due to the limitations of assigning an activity to the products classified according to HS 12.
European comparison: where does Spain lie?
Compared to other large European economies (Germany, France, Italy and Portugal), Spain still has margin for improvement. In the second chart, we show the percentage of each country’s exports that are classified as complex, as having a high technological content and those that are also considered competitive. As we can see in the chart, Spain ranks at the tail end of the group in terms of the percentage of exports considered high-tech, and it is second from the bottom in the proportion of complex exports. In the percentage of exports that are competitive and complex, it performs somewhat better and ranks above France and Portugal, but below Italy and Germany.
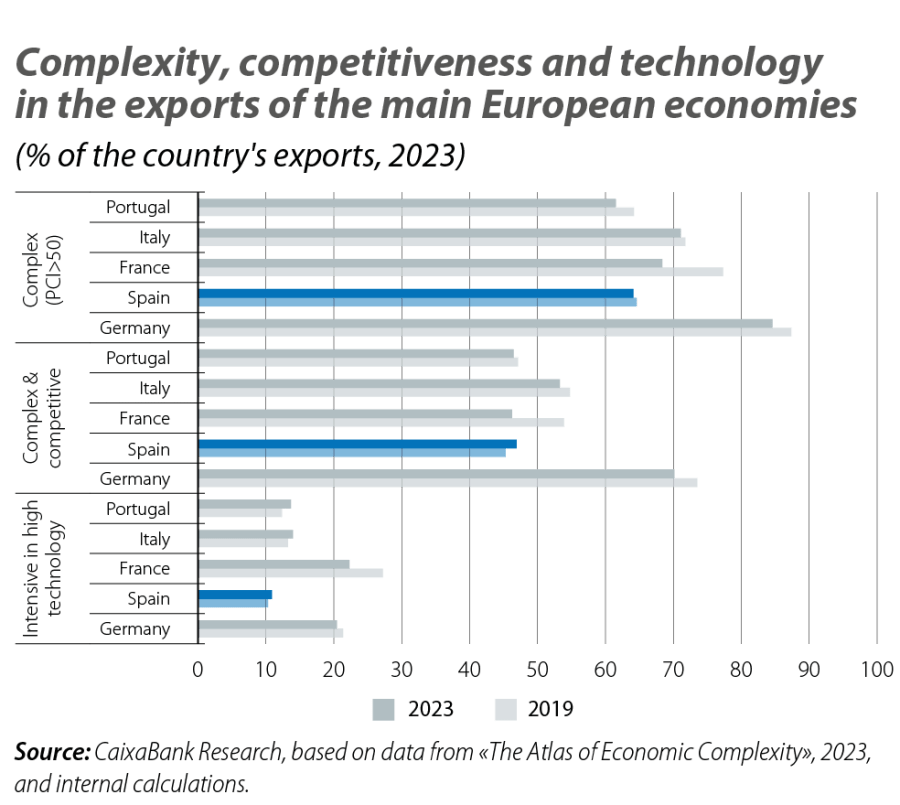
Even so, Spain is the only economy in the group that has increased its competitiveness in complex exports since 2019. In addition, together with Italy and Portugal, it has increased the percentage of exports classified as high-tech, as well as its market share for this type of exports. This contrasts with the fall in the complexity of products exported by the main European economies.
If we analyse the ECI rather than looking at the complexity of specific products, we see a downward trend among the major European economies that goes back to the financial crisis (see third chart). However, since 2019, both Spain and Portugal have improved their positions in the ranking. Spain has gone from 39th to 34th place and Portugal has improved from 47th to 37th place. In contrast, Germany, which in 2019 ranked fifth (and between 1995 and 2016 had remained in the top 4), has fallen to sixth place in 2023. France is down four positions and ranks 23rd, below Italy, which itself has fallen two positions and stands at 19th.

Digitalisation & Technology
The keys to understanding how digitalisation and new technologies are substantially transforming the economy and how society works.