The oil market enters unknown territory
The conflict now widely referred to as the Third Gulf War has caused the largest disruption on record in the global energy market. The main point of tension is the Strait of Hormuz, a key maritime route through which around 20% of global oil and liquefied natural gas (LNG) passes. With the strait effectively closed, a large share of the region’s energy production is blocked. Energy markets reflected this scenario: the price of oil hovered around 100 dollars per barrel in the final weeks of March, driven by supply disruptions, attacks on tankers and damage to critical energy infrastructure.

Pre-conflict situation: solid fundamentals but with risks
Up until the outbreak of the conflict, the market was in a comfortable position, with supply growth outpacing that of demand. A surplus of approximately 1.5-2.0 million barrels per day (mb/d) was driven by increased production in non-OPEC countries, the accelerated reversal of OPEC+ cuts, and demand in a moderate growth phase.1 On the other hand, global oil inventories (crude and derivatives) stood at around 8.2 billion barrels, equivalent to approximately 80 days of global consumption, marking the highest level in five years and above the historical average.2 All this pointed to a relatively contained underlying Brent price (close to USD 60 per barrel), to which a risk premium was added, linked to the build-up of geopolitical risks and conflicts in regions with the potential to disrupt market stability.
- 1
The International Energy Agency (IEA) anticipated an average growth in supply of 2.4 mb/d in 2026 (vs. 3.1 mb/d in 2025), compared to a demand growth of 0.9 mb/d in 2026 (vs. 0.8 mb/d in 2025). See the «Oil Market Report» from February 2026.
- 2
Around half of these are located in OECD countries, of which 1.25 billion barrels are held by governments (emergency reserves) and another 600 million barrels are industrial reserves maintained under government obligations.
Hormuz, a critical strait: a vital artery for the global economy
Oil traffic passing through the Strait of Hormuz historically stood at around 20 mb/d. According to data on daily flows through the strait, a drop in traffic of over 90% has been observed since the start of the conflict. In this context, there are alternative routes through which Gulf countries can redirect part of the oil flows,3 but even with these alternatives the closure of Hormuz implies a loss of supply of some 15 mb/d.
Some factors that could mitigate this supply shock have already been set in motion. The IEA has announced the release of 400 million barrels of strategic reserves, although there is uncertainty regarding the release rate, which could be between 1 and 3 mb/d. In addition, non-OECD countries may release some of their strategic reserves and sanctioned crude oil could enter the market, contributing an additional 2-3 mb/d.4 Adjusting for the release of reserves, in the short term the net impact of the closure of the Strait of Hormuz is estimated to be between 8 and 12 mb/d, which would mean the loss of some 300 million barrels of oil in one month of conflict. These levels are significant, but manageable in scenarios with a brief conflict. Once the conflict is over, it is uncertain how long it will take for the flows passing through Hormuz to return to their historical levels. In particular, the deterioration of security conditions in the strait or damage to logistical and productive infrastructure in the region could result in it taking longer for trade flows to be re-established.
To the extent that the conflict drags on and imbalances between oil supply and demand accumulate, the likelihood of scenarios in which prices could be substantially higher than they were in March also increases, in an attempt to moderate a highly inelastic demand.5 Additionally, the recovery of pre-conflict production levels could require longer timeframes and increase the risks of a structural deterioration in productive capacity.
- 3
The East-West pipeline, which connects the oil fields in the east of the Arabian Peninsula to the port of Yanbu on the Red Sea, has a capacity to transport up to 7 mb/d (vs. utilisation of 1.5-2 mb/d in 2025). The Abu Dhabi pipeline, which connects the UAE’s refineries with the port of Fujairah in the Gulf of Oman, has limited re-routing capacity due to its high level of utilisation and vulnerability to Iranian attacks.
- 4
In particular, it is estimated that China holds strategic reserves exceeding 1 billion barrels (equivalent to around 90 days of domestic consumption), although it has not yet announced the release of those reserves. In recent years, there has been an accumulation of sanctioned Russian and Iranian crude oil stored on ships. It is estimated that there are 100-150 million barrels of sanctioned Iranian crude oil (out of a total of almost 300 million).
- 5
For reference, in March 2022, the price of Brent crude oil approached 140 dollars per barrel.
A global dependency on the Gulf, but with variable geography
Despite the global nature of the shock, its impact will be asymmetric. On the one hand, the direct dependency on energy flows from the Gulf varies significantly by country. 90% is destined for Asia and approximately half of the crude oil imported by India and China originates from the region,6 while this figure exceeds 70% in the case of South Korea, and 80% for Japan. By way of comparison, in the case of the EU, crude oil imports from the Gulf account for between 10% and 20% of the total.7
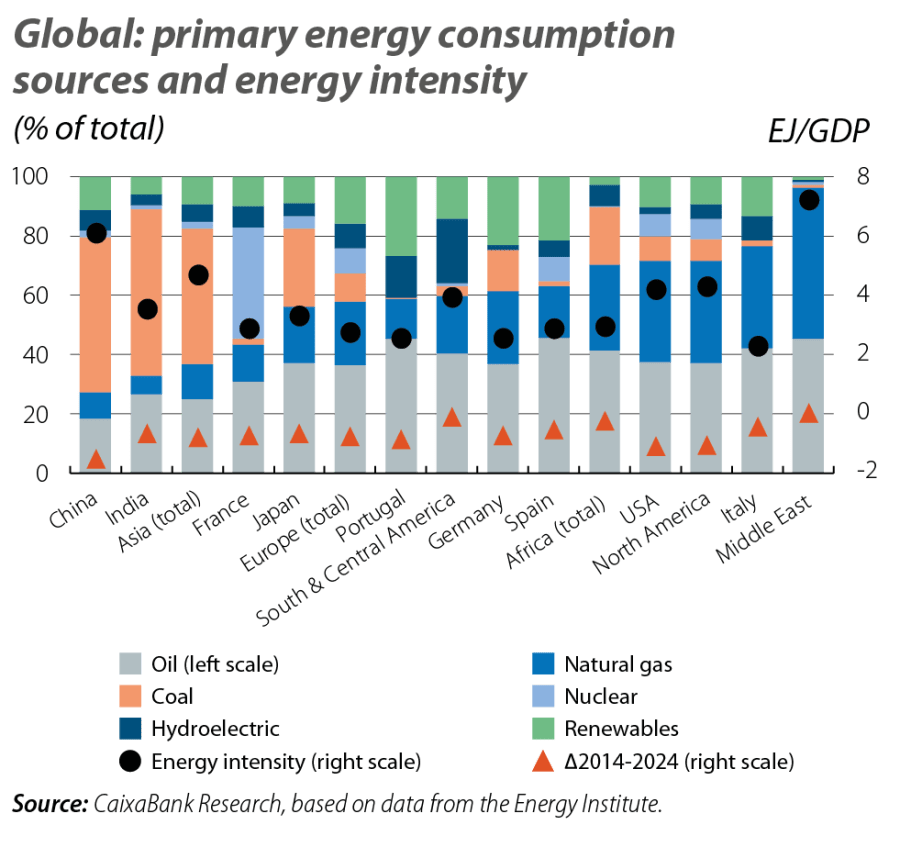
On the other hand, the energy mix varies significantly between countries, as does their energy intensity, that is, the amount of energy required for economic activity. At one end of the spectrum are the countries of the Middle East themselves, with a very high energy intensity and a primary energy consumption derived almost exclusively from oil and gas. Asian emerging markets also exhibit high energy intensity, especially China, but with intensive coal consumption. Asian emerging markets also tend to exhibit high energy intensity, especially China, where coal consumption remains particularly intensive. Among advanced economies, which generally display lower energy intensity, France and Japan stand out for their relatively lower dependence on oil and gas, while the United States and Italy’s energy mixes remain heavily reliant on fossil fuels.8
- 6
These two countries are the largest importers of crude oil from Russia, which accounts for around 35% of India's crude oil imports and 20% of China's.
- 7
In the case of natural gas, the situation is somewhat different. Despite Qatar being the largest global exporter of LNG, the observed dependencies on flows from the region are somewhat less pronounced, and import volumes are also significantly lower. Also, about 20% of the LNG imported by China comes from the region, although these imports are far inferior to those delivered via pipelines. Japan and India also show limited dependence on the region, while Pakistan and Korea show somewhat higher dependencies. Other major exporters of natural gas to Asia include Russia, Australia, the US and Malaysia. In the case of the EU, around 5% of LNG imports come from the Gulf. On the other hand, unlike the case of oil, the cost of storing LNG results in substantially lower natural gas inventories, which increases the vulnerability of economies more dependent on natural gas to supply disruptions and price fluctuations.
- 8
For further details on the sectoral impact and monetary policy implications in the euro area, see the Focuses «Geoeconomic exposure and strategic relevance of the Middle East» and «Energy tensions, inflation and monetary policy in the euro area» in this same report.
Duration of the conflict: a key (known) unknown
The economic impact of the conflict will be transmitted through various channels, notably energy, international trade, financial conditions, and uncertainty, the intensity and scope of which will depend on the duration of the conflict and the credibility of a potential ceasefire.
Some of the factors that could prolong the conflict include the ability of the Iranian leadership to maintain a status quo in the country and successfully resort to asymmetric warfare strategies, the ambiguity of the US and Israeli military objectives, the risk of a regional escalation, and the difficulty in achieving a ceasefire if maximalist conditions are imposed. Conversely, the US electoral calendar, the weakening of Iranian leadership, and damage to infrastructure increase the political and economic costs of prolonging the hostilities. In any case, it can be expected that, even under an early ceasefire, the medium-term scenario will remain marked by significant risks of renewed tensions.
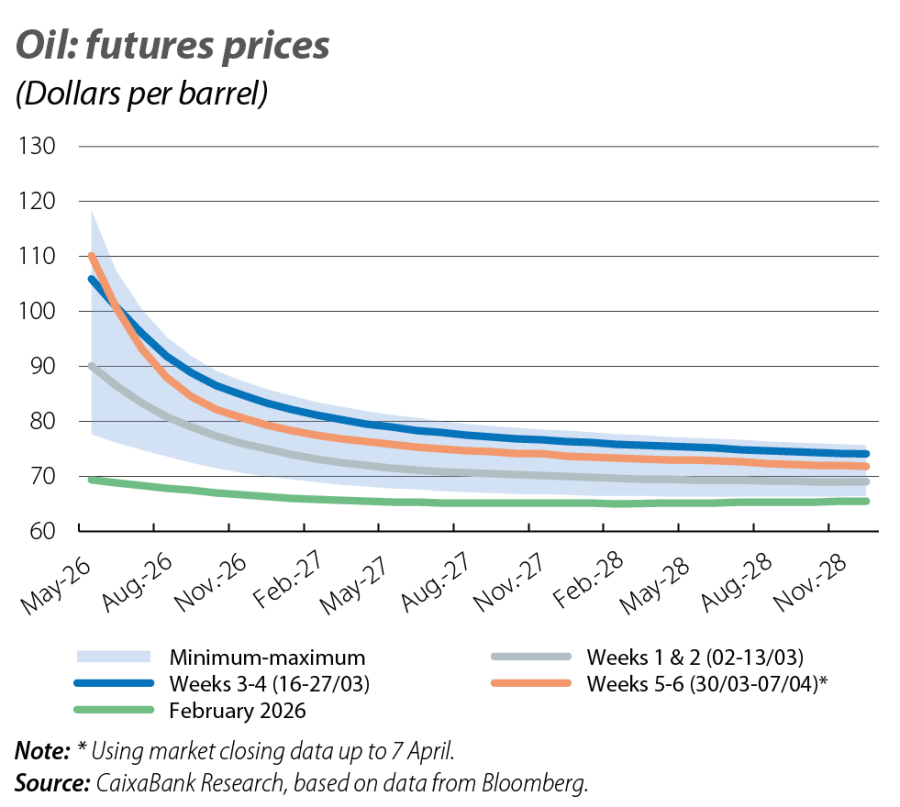
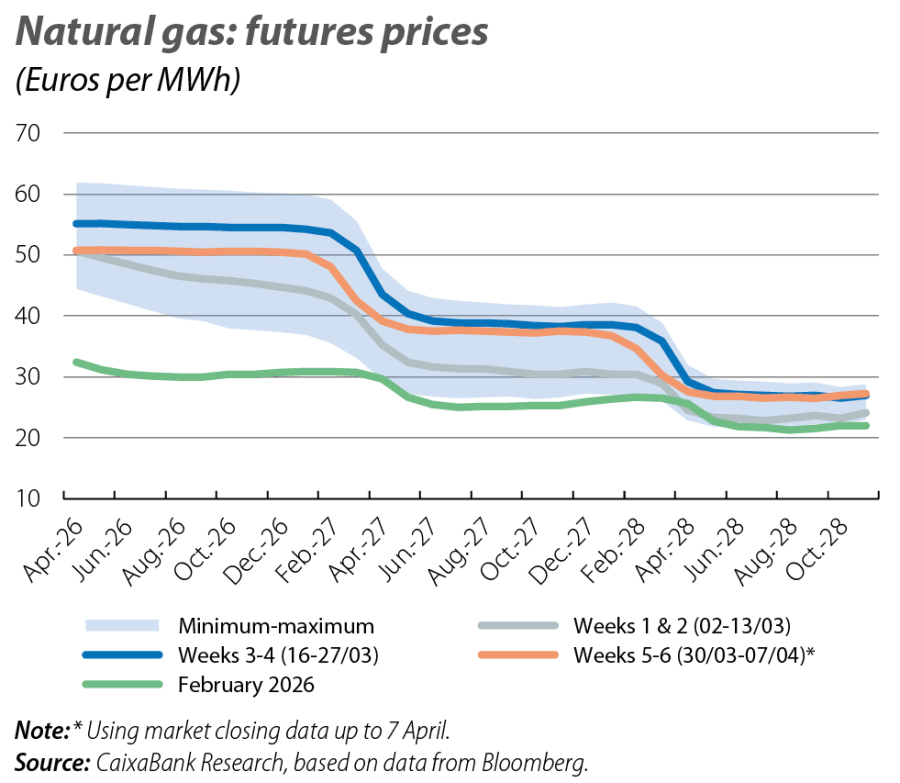
Faced with a considerable range of known uncertainties (or known unknowns), such as the duration of the conflict or the extent of the damage to energy infrastructure, the market response during the first month of conflict could be explained by different layers of uncertainty.9 On the one hand, this could be a certain intuition (or an unknown known) that at least one of the parties will not be willing to engage in a prolonged conflict, given the rapidly rising economic costs of a disruption of this magnitude. By the end of March, with Brent futures trading at around 80 dollars one year ahead (up from 65 dollars in February) and natural gas futures at around 50 euros (versus 30 euros in February), the markets seem to be anticipating a relatively short-lived conflict, with limited structural damage and a stable ceasefire, along with a steady recovery of trade flows through Hormuz. On the other hand, the environment of elevated geopolitical risk and heightened market volatility points to a risk distribution with a heavy negative tail, skewed by an ample set of unknown unknowns.
- 9
The Rumsfeld Matrix, popularised by the former US Secretary of Defense, Donald Rumsfeld, in a press conference in 2002 during the Iraq War, is a framework for analysing information and uncertainty in strategic decision-making. It distinguishes four types of knowledge. Known knowns are facts that we know and understand well, and they form the basis on which decisions are made. Known unknowns are aspects we know exist, but about which information is lacking. Unknown knowns are pieces of knowledge we possess but do not recognise or consciously use, such as accumulated experience or intuition. Finally, unknown unknowns are factors we are unaware of and cannot anticipate, which often involve the greatest risks, such as extreme events (or «black swans») and unidentified risks.