2027: monetary outlook and fiscal implications
We are approaching 2027 with expectations of higher interest rates, reflecting the new inflation outlook and the impact of the conflict in the Middle East. In recent months, inflation in Europe and the US has approached 4%, driven by a 20% rise in consumer energy prices. In response, the ECB and the Fed have begun raising interest rates to cool demand and ease price pressures.
A measured tightening of financial conditions
Central banks are expected to continue tightening monetary policy over the coming quarters, but with a measured approach. Specifically, we expect ECB rates to peak at 3.00% and Fed rates to reach 4.00%-4.25%, which would leave interest rates in 2027 some 100 basis points above pre-war expectations. There are several reasons why we expect a measured tightening. Above all, the outlook hinges on geopolitics and could therefore shift rapidly in different directions, requiring central banks to act with agility and caution (given the lags in monetary policy transmission). The ECB and the Fed can also do little to curb the energy price inflation caused directly by the shock in the Middle East. Their mission is to prevent higher energy costs from feeding through to other prices in the economy (so-called indirect effects) and causing inflation to spread. Moderate growth in aggregate demand, which limits the scope to pass on higher costs to final prices, and inflation expectations anchored at the 2% target support a continuation of measured monetary tightening. If the containment of the indirect effects seen so far is confirmed in 2027, this could even pave the way for the first interest rate cuts by the ECB and the Fed.1
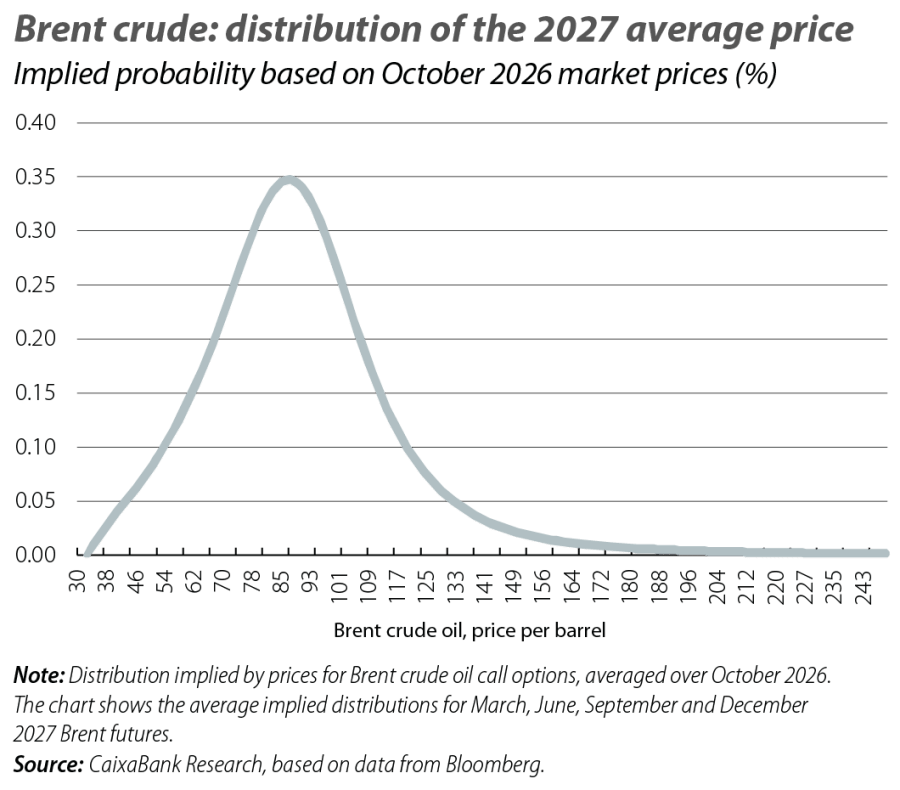
However, last summer’s failed attempt to resolve the conflict between the US and Iran has prolonged the energy disruption and increased uncertainty, heightening the risk of spillovers to other prices and more persistent inflation. Our September forecasts were based on 2027 market prices of around 80 dollars a barrel for Brent crude and 45 euros/MWh for TTF gas. In October, futures prices were already pointing to Brent crude averaging just over 90 dollars and gas close to 70 euros over 2027 as a whole, albeit with some easing during the year (moderating from 105 dollars and 80 euros in January to 85 dollars and 60 euros at the year end). Markets themselves are also pricing in considerable uncertainty, as shown by the distribution of Brent prices in the first chart, based on the options market.
- 1
Between the spring and summer, inflation should fall sharply owing to a strong step effect driven by energy base effects, as the year-on-year comparison will already include the first months of the conflict.
What if indirect inflation effects take hold?
Although a rapid easing cannot be ruled out – over the summer, energy prices showed how quickly they could fall if the military conflict is brought under control – the risk of prolonged disruption is more concerning. We will therefore focus on Europe in order to assess the prospect of energy prices remaining high for longer and the potential knock-on effects on broader inflation.
The exercise starts with the risk priced in by financial markets themselves in October. Specifically, we use derivatives markets (call options) on Brent crude oil and TTF gas futures to derive a distribution of possible prices, as shown in the first chart, and analyse two alternative paths for 2027. At the 75th percentile (p75, the threshold for the top 25% of prices), markets point to Brent averaging 105 dollars and TTF nearly 80 euros in 2027. At the 95th percentile (p95, the top 5% of prices), the figures would be around 135 dollars and 135 euros. This could translate into annual growth in the euro-area energy CPI of between 10% (p75) and 20% (p95) in 2027.2
Besides the direct impact on headline inflation, estimated at 1-2 percentage points under these alternative scenarios, we assess the potential pass-through to other prices based on the energy intensity of the various CPI components.3 The second chart summarises this analysis, showing a range of possible inflation rates depending on the severity of the energy shock and the extent to which it feeds through.
- 2
As suggested by regressions of the Brent crude oil price against the fuel CPI and the TTF gas price against the electricity CPI.
- 3
We replicate the methodology used by Fagandini et al. (2024), «Decomposing HICPX inflation into energy-sensitive and wage-sensitive items», ECB Economic Bulletin 3/2024, to calculate an «energy-sensitive» HICP. Using input-output tables, each sector’s energy intensity is calculated as the portion that intermediate energy consumption represents in its total output. After allocating sectoral energy intensity across CPI sub-items, we pass through higher energy costs in proportion to the ratio between each component’s energy intensity and that of purely energy-related items.
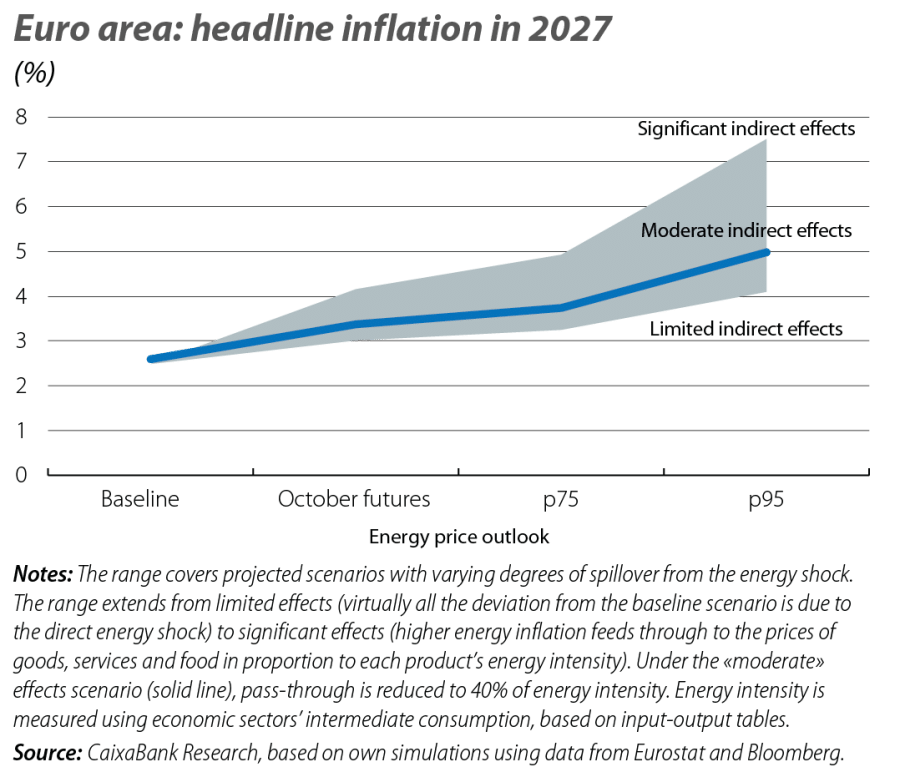
Our baseline scenario, which uses energy futures from early September and assumes modest indirect effects, places euro-area inflation at 2.6% in 2027. Incorporating the latest data and October gas and oil futures, however, could lift inflation into the 3.0-4.0% range. At the 75th percentile, it would rise to 3.0-5.0%, while under more extreme, high-pass-through scenarios, the analysis suggests the range could extend as high as 7%.4
- 4
The «significant indirect effects» scenario assumes strong pass-through: energy inflation of 20% pushes core inflation close to 5%. For comparison, after energy inflation reached 37% in 2022, euro-area core inflation remained close to 6% for much of 2023. In the «moderate indirect effects» scenario, we limit pass-through to 40% of energy intensity, resulting in energy-to-core inflation pass-through similar to that seen in 2022. Moderate demand growth and anchored inflation expectations support more limited pass-through. By contrast, memories of the 2022 inflation crisis may influence behaviour and lead to more pronounced indirect effects.
Monetary policy paths and fiscal consequences
The above exercise illustrates the risk of further monetary tightening if the energy disruption persists. The perfect storm following the 2022 energy shock gives a ceiling to how high the ECB and the Fed may be willing to raise rates5 in a severe scenario. At the same time, monetary tightening need not be delivered solely through higher interest rates: central banks can also keep rates in restrictive territory for longer. In other words, whereas the baseline scenario envisages a transitory shock (with an easing of energy prices or weaker indirect effects) which would pave the way for the first rate cuts in late 2027, a more prolonged US-Iran conflict and disruption to energy flows could cause interest rates to be kept restrictive for longer.
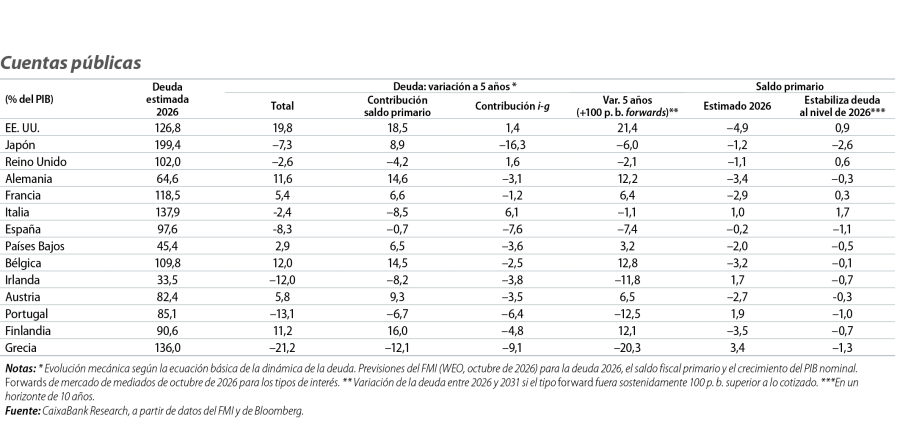
So far, the energy shock appears to be primarily a story of inflation and monetary policy. But keeping interest rates higher for longer has a second consequence: it gradually raises the cost of financing public debt – a particular concern in economies with fiscal imbalances such as France and the US. The impact of higher interest rates on their short-term debt dynamics is limited, thanks to long average maturities (around eight and six years, respectively). The path of public debt depends on each country's deficit, its borrowing costs and the pace of its economic growth. This allows us to project debt dynamics and break down their evolution. As the final table shows, the main factor driving the rise in the public debt ratio in economies such as the US and France is persistently high primary budget deficits, pointing to a further deterioration in already elevated debt ratios. By contrast, Europe’s traditional periphery looks set to continue to reduce its debt levels if it stays the fiscal course and meets economic growth forecasts. This rebuilding of fiscal space will be key, given the increasing frequency of supply shocks and disruptions in recent years.