
Innovation, expectations and vertigo: is AI-driven concentration reshaping Wall Street?
Optimism surrounding artificial intelligence (AI) has been a key driver in the US stock market rally of recent months, helping the S&P 500 and the Nasdaq to record gains for the third consecutive year in 2025. Part of this expansion was explained by increased earnings, although the S&P 500 has recorded greater growth relative to these profits. In this rally, various analysts and investors have seen reminiscences of events from the year 2000 during the dot-com boom, sparking a debate about whether or not we are in a bubble. Although answering this question in real time is like trying to untie a Gordian knot by hand, in this article we analyse how the S&P 500 today compares with that of the dot-com bubble, and how feasible the expectations underpinning current stock market valuations are.

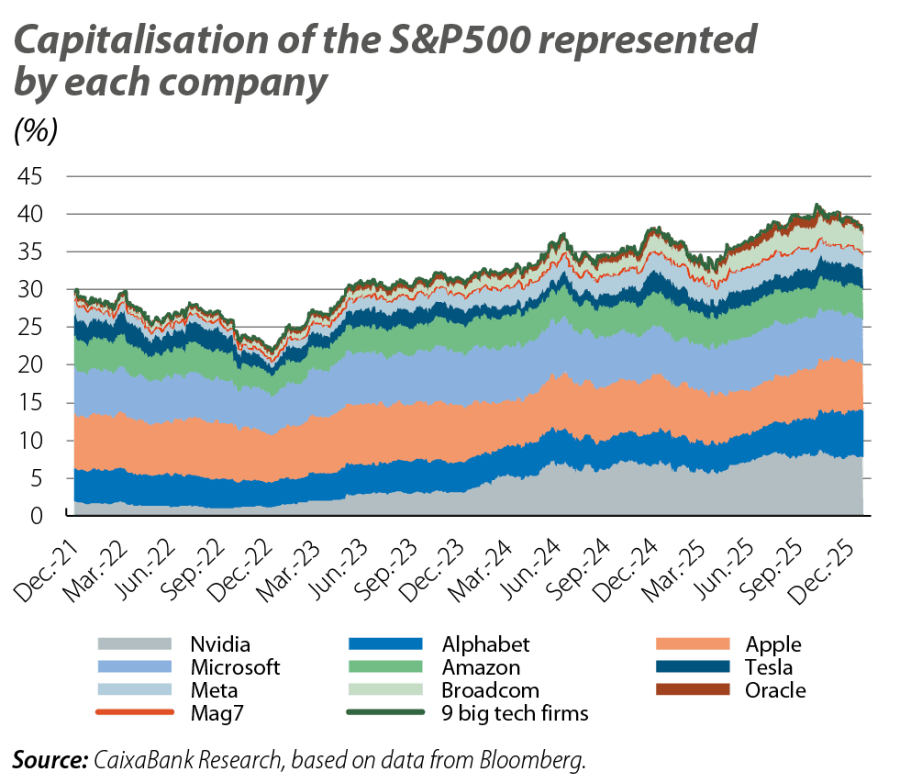
The first clear effect of AI on the US stock market has been an increase in concentration in various areas: returns, company size and earnings, as well as in investment. Thus, the so-called Magnificent 7 (or Mag7: tech firms that are leaders in innovation, with large market capitalisation and diversified business models well protected from potential competitors)1 once again outperformed the remaining 493 companies in the index in 2025, for the third consecutive year (+25% compared to 14% in 2025; and +245% compared to +30% since the end of 2022, respectively).2 This increased their relative capitalisation in the S&P 500 from 20% at the end of 2022 to over 35% by the end of 2025 (and if we consider the next two largest tech companies, the percentage rose to over 40%). This concentration contrasts sharply with the 17.5% accounted for by the seven largest companies at the height of the dot-com bubble.3 On the other hand, in terms of profits, the earnings per share among the Mag7 grew by 30% in the first three quarters of 2025, compared to 6% for the S&P 493.
The growth of tech firms has had another indirect effect: it has contributed to the increase in the relative price of the index. Let us consider a common measure of affordability, the P/E (Price-to-Earnings) ratio, which compares a company’s market capitalisation to its ability to generate profits. The P/E ratio of the S&P 500, measured against the earnings recorded over the last 12 months, fluctuated between 27 and 28 points in recent weeks; this is above its historical average (20.2 since 1990) and in the high range of its historical distribution (in 90% of sessions since 1990 this ratio has been below 27.3).
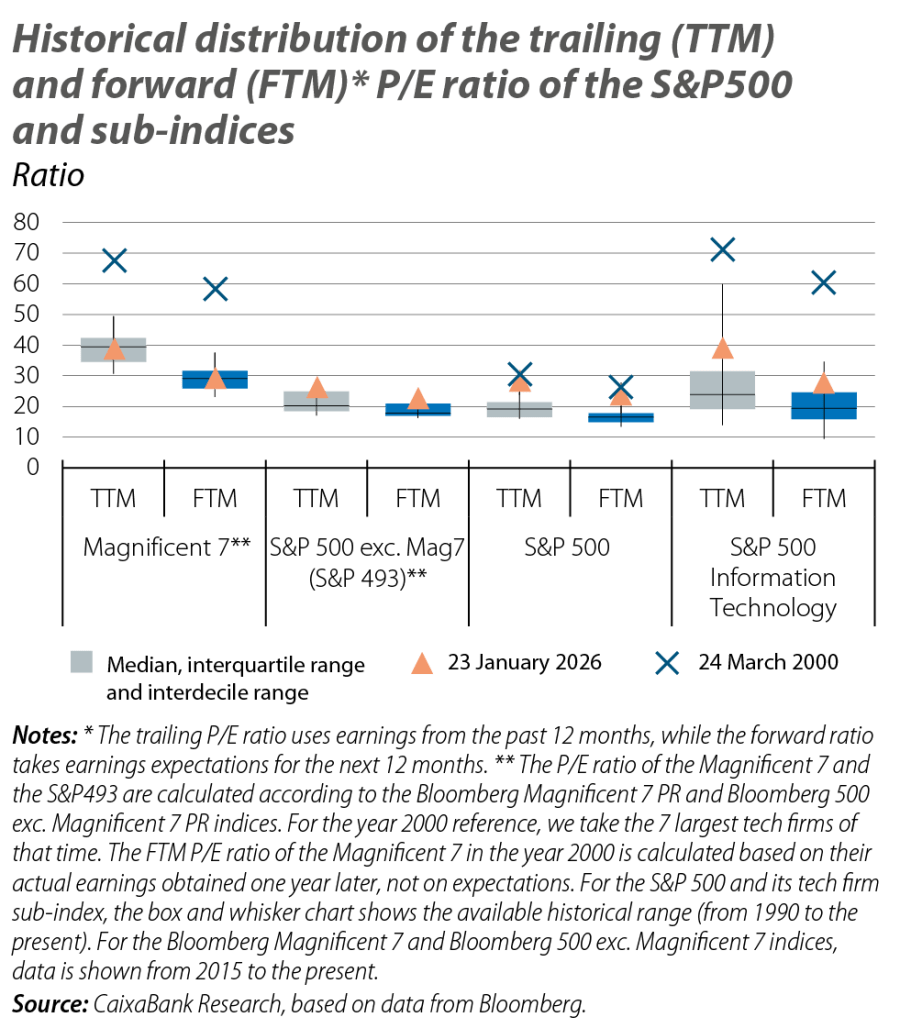
Part of this situation is explained by the aforementioned concentration, as the Mag7 and tech firms in general4 currently have the highest P/E ratio in the index. This is also historically common,5 due to investors’ typically ambitious long-term earnings expectations for these companies.
In fact, in historical terms, the P/E ratio of tech firms is not so high relative to their recent earnings, nor compared to their future expected earnings. Thus, if we compare the current P/E ratio levels with those at the peak of the dot-com bubble, the P/E ratio of the Mag7 currently lies at around 40 points, based on earnings from the last 12 months, and at around 30 if measured against expected earnings over the next 12 months; these are considerably lower levels than those of the seven biggest tech firms by capitalisation at that time, which were 69 and 59, respectively.6
- 4
Taking here the sub-index of the information technology sector of the S&P 500.
- 5
Excluding the real estate sector, which, nevertheless, has a much lower relative weight (around 16 times less) than the technology sector.
- 6
In the case of the forward P/E ratio for the Magnificent 7 of the year 2000, rather than basing the calculation on market expectations, we take the actual profits they recorded in the following 12 months. The fall in these companies’ aggregate earnings led to a P/E ratio of 76 being recorded in Q3 of the year 2000.
The rise in the relative price of the S&P 500, however, is not solely explained by the concentration in the Mag7 and other tech firms. The optimism surrounding AI has also contributed to gains among industrial companies (particularly those involved in the construction of data centres, as well as those more closely linked to defence and the aerospace sector). Financial firms – the second most significant sector in the index, with a historically low P/E ratio – are also in the high range of their historical distribution (with the trailing-12-month P/E ratio lying above 18, close to the 90th percentile of the historical distribution).
Finally, it is noteworthy that the P/E ratio of the S&P 500 is also high if adjusted for the cycle (taking its price in relation to real earnings, adjusted for inflation, over the last 10 years). According to this long-term P/E ratio, also known as the CAPE (Cyclically Adjusted Price-to-Earnings) ratio, the index is not yet as strained as it was during the dot-com bubble (estimated at 39.9 points in December 2025, compared to the peak of 44.2 reached in December 1999), although it is already at historically high levels.
Traditionally, a high CAPE ratio suggests that prices will revert to the average, although it does not tell us when this might happen. However, the two most critical factors for the sustainability of the scenario are expectations regarding earnings growth and interest rates, which affect the net present value (i.e. discounted to today) of expected future earnings.
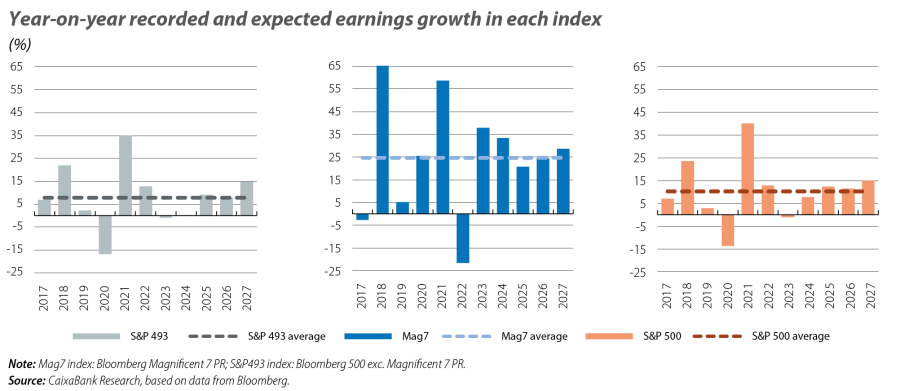
Analysts’ earnings growth expectations are ambitious, but at least in the short term they are not misaligned with the historical average, both for the Mag7 and for other companies. For the Mag7, earnings per share (EPS) growth of 24.4% is expected over the next 12 months, compared to an average aggregate net earnings growth among these seven companies of 24.7% since 2017.7 For the rest of the index, an 8% growth rate in EPS is expected, compared to the 7.8% average recorded since 2017. For the S&P 500 as a whole, expectations are for EPS to grow by 11.7%, compared to the 10.2% average recorded since 2017.
On the other hand, any potential tightening of interest rates in the US would reduce the present value of these expected earnings, not only due to a discount factor but also because of higher financing costs. In this regard, there is a systematically negative relationship between interest rates and valuation ratios.8 Although interest rates are historically high, the presence of various risks (geopolitical, trade and fiscal tensions) do not allow us to rule out further hikes.
Ultimately, AI has catalysed concentration in the S&P 500 and, as a result, strained the index relative to the earnings of the companies that comprise it. Although the affordability indicators are not yet as strained for tech firms as they were during the dot-com bubble, they rest on demanding growth expectations, as well as on macroeconomic assumptions that are highly delicate in the current context, such as that interest rates will not become more strained again.
Digitalisation & Technology
The keys to understanding how digitalisation and new technologies are substantially transforming the economy and how society works.