The differing speeds of inflation: a differential calculation for the ECB
The euro area reached the ECB’s inflation target in 2025. Headline inflation fell to 2.1% for the year as a whole and closed at 1.9% in December, while most agents’ expectations also place it at 2% in the medium term. How has this final disinflation towards the 2% target played out? Which products and countries have contributed the most? What inertia remains?
For the first time in three years, in 2025 disinflation was supported more by the core components (industrial goods and services) than by the more volatile ones. This reflects disinflation that is occurring at different speeds, mirroring the previous inflationary crisis itself: energy and food prices, which were the most strained in 2022, also led the first stage of the disinflation in 2023. In contrast, non-energy industrial goods and especially services lagged behind, leading the disinflationary process in 2024 and 2025 after having accelerated in 2023.
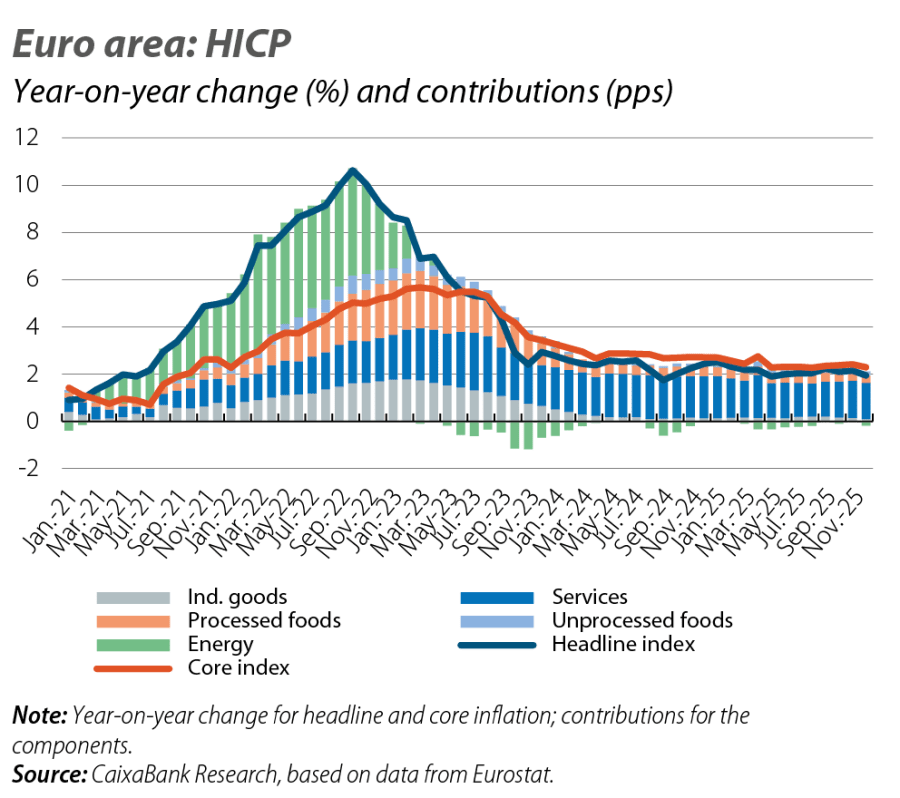
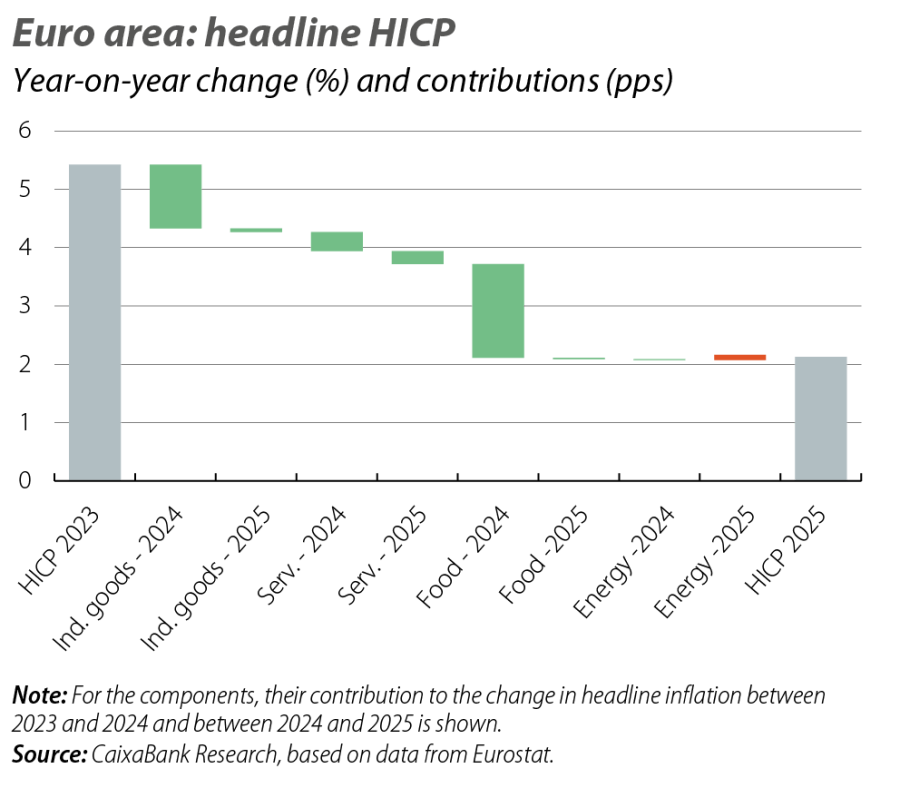
These differing speeds still persist in the latest inflation data. The main discrepancy is the inertia still present in services, with an inflation rate of 3.4% both for 2025 as a whole and in the last quarter and month of the year, which has been offset by the low inflation of non-energy industrial goods (0.6% in 2025, its lowest figure since the pandemic). The inertia of services is largely explained by the final ripple effects from the transmission of the inflationary crisis, and the latest data show that it is mainly due to the lagging behaviour of labour-intensive services (which also, consequently, are more sensitive to wage growth), energy-intensive services, and services that update their prices infrequently.1 With headline inflation normalised, energy prices contained and wages decelerating, over the coming quarters we can expect service inflation to make definitive progress in its normalisation.
- 1
For example, in December 2025, prices related to transport, public services (post, waste collection, hospitals) and insurance accounted for nine of the top 10 items with the highest inflation in the core basket and contributed 0.5 pps to a core inflation rate of 2.3%. Inflation in insurance-related services also has inertia because it is affected by past inflation in the products being insured.
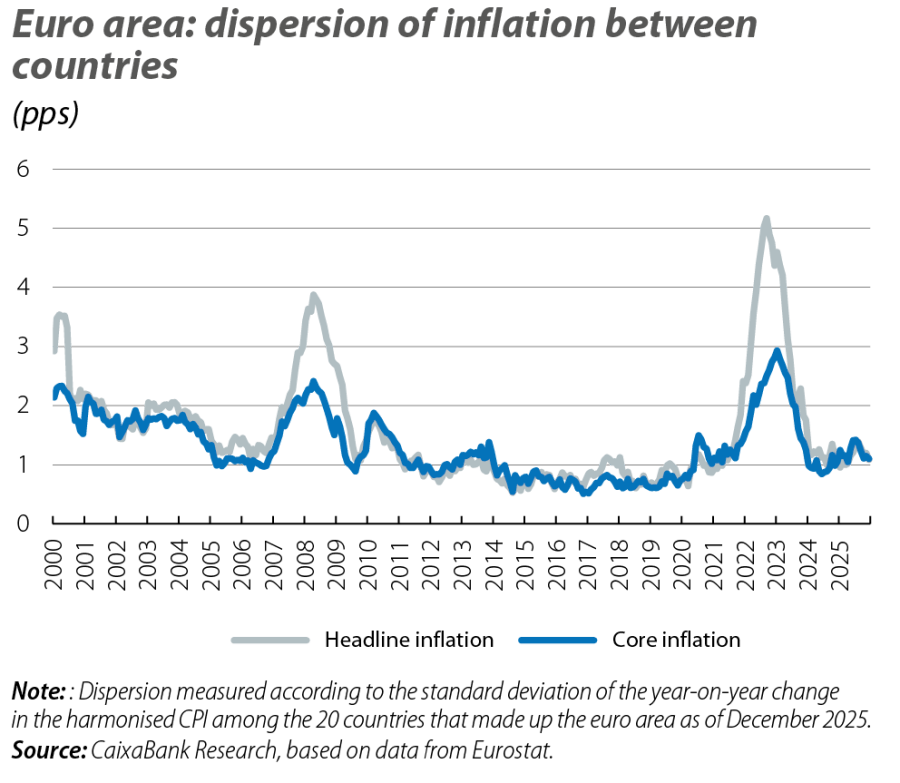
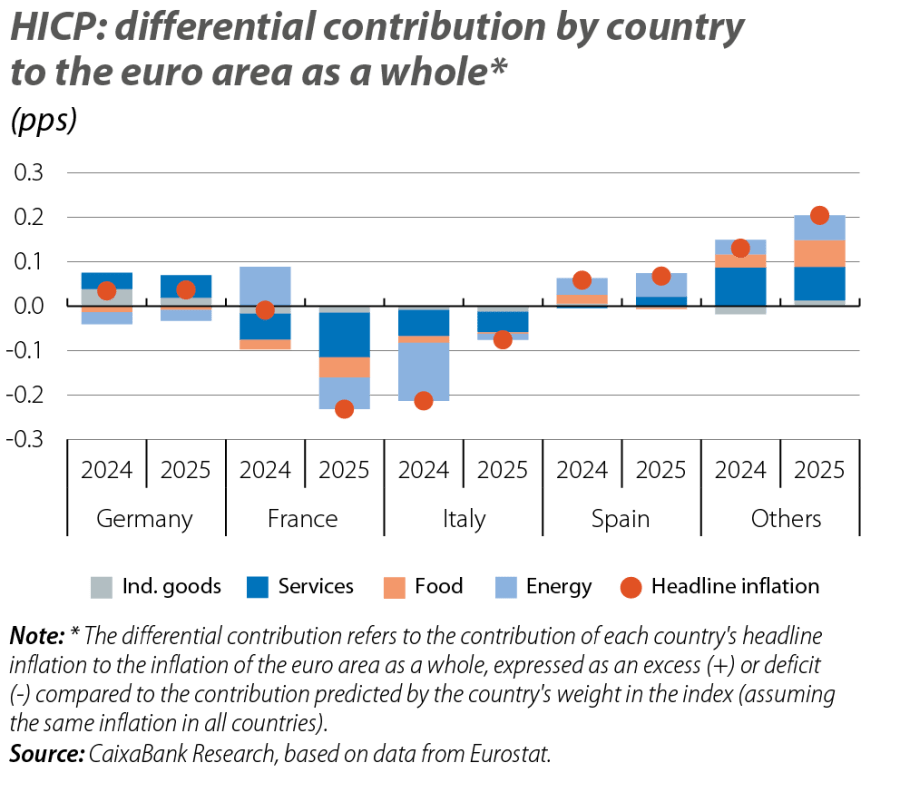
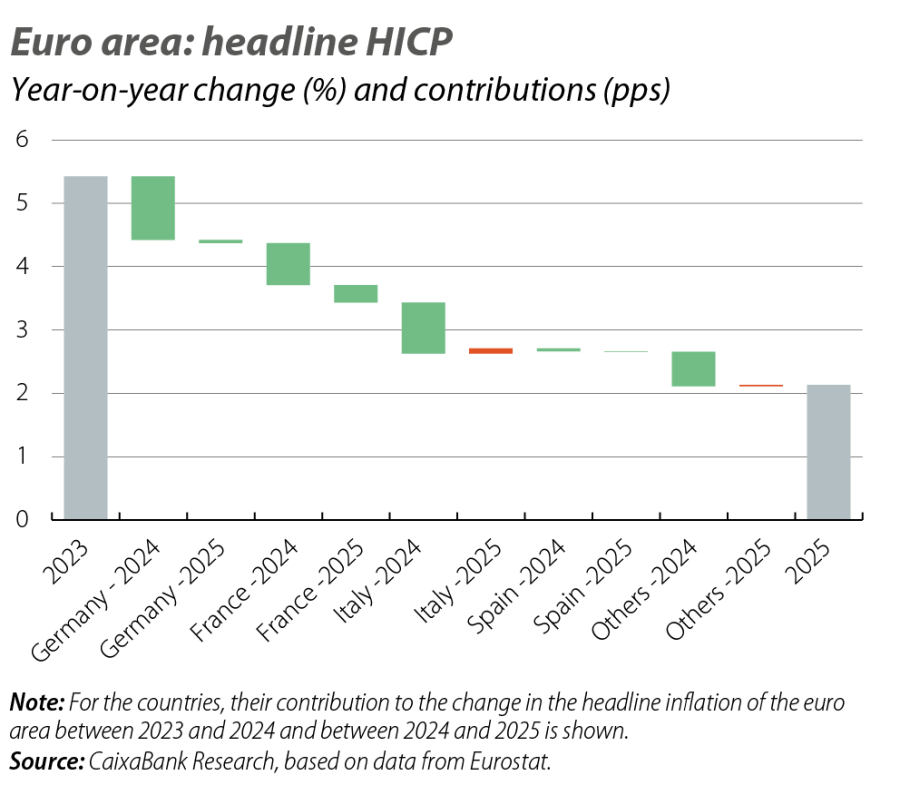
On the other hand, the return of headline inflation to 2% has also corrected the dispersion between countries that had been generated during the 2022 crisis. Small economies that were heavily impacted by the energy shock, such as the Baltic states (Estonia, Latvia and Lithuania saw inflation rates in excess of 20% in 2022), have recorded sharp disinflation (although their inflation rates still remain high within the euro area, at between 3% and 4%). Among the four major European economies, the country that provided the greatest boost to the disinflation of the euro area as a whole in 2025 was France, while Germany and Spain also helped to reduce it (albeit more moderately). Italy, on the other hand, actually pushed it up slightly due to base effects related to energy prices.
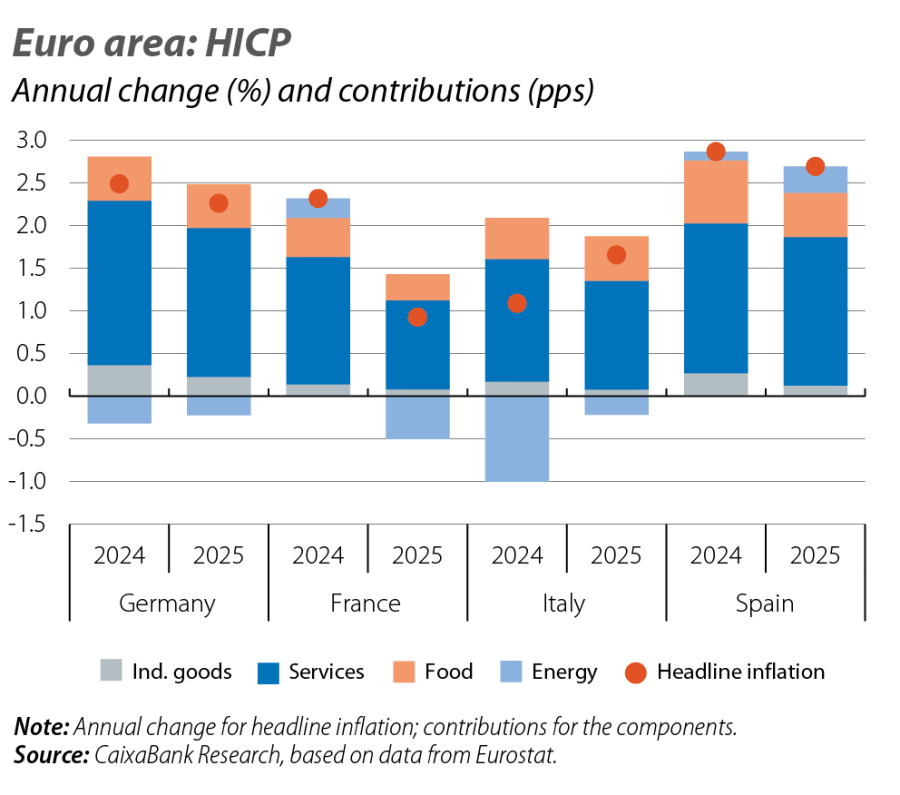
In terms of levels, France stands out for having the lowest inflation, largely driven by a negative contribution from energy due to the more gradual manner in which the rise in energy costs filtered through to French prices during the crisis.2 The negative contribution from energy also persisted in Germany and Italy, whose energy dependence on Russia initially led to a relatively higher increase in energy costs (the energy CPI rose by 35% in Germany and by 51% in Italy in 2022 as a whole), although by 2025 it had become more residual in quantitative terms. Spain, for its part, has recorded inflation somewhat higher than the euro area average, largely explained by higher inflation in energy and food compared to the euro area.3
- 2
In 2022, France opted for direct interventions on gas prices. Thus, the tightening of its energy prices was less pronounced in the short term, but so was their subsequent easing.
- 3
In terms of the harmonised CPI, Spanish inflation was similar to that of the euro area in non-energy industrial goods and services (0.3 pps lower in the former, 0.2 pps higher in the latter), lower in processed foods (1.0 pp) and significantly higher in unprocessed foods (2.4 pps) and energy (4.6 pps).
Taken together, the 2025 figures depict inflation at the ECB’s 2% target. However, behind this normalisation there is a dispersion among components that reflects the wide variety of risks surrounding the scenario: from the inertia of services (which ought to moderate with wages) to the low inflation of goods (subject to risks of tariff disruptions and the redirection of trade), to food and its sensitivity to extreme weather events.