European inflation: taking stock of the Middle East shock
The conflict in the Middle East has raised European inflation to around 3% and has pushed the ECB out of its comfort zone. On 11 June, the central bank raised interest rates, and both its recent communications and financial market prices suggest that it will do so again in the coming months. The main issue is not the direct impact of rising energy costs, but the risk that this increase could spill over to other prices in the economy, leading to excessively high and persistent inflation. What do the data tell us about this spillover?
Significant direct impact
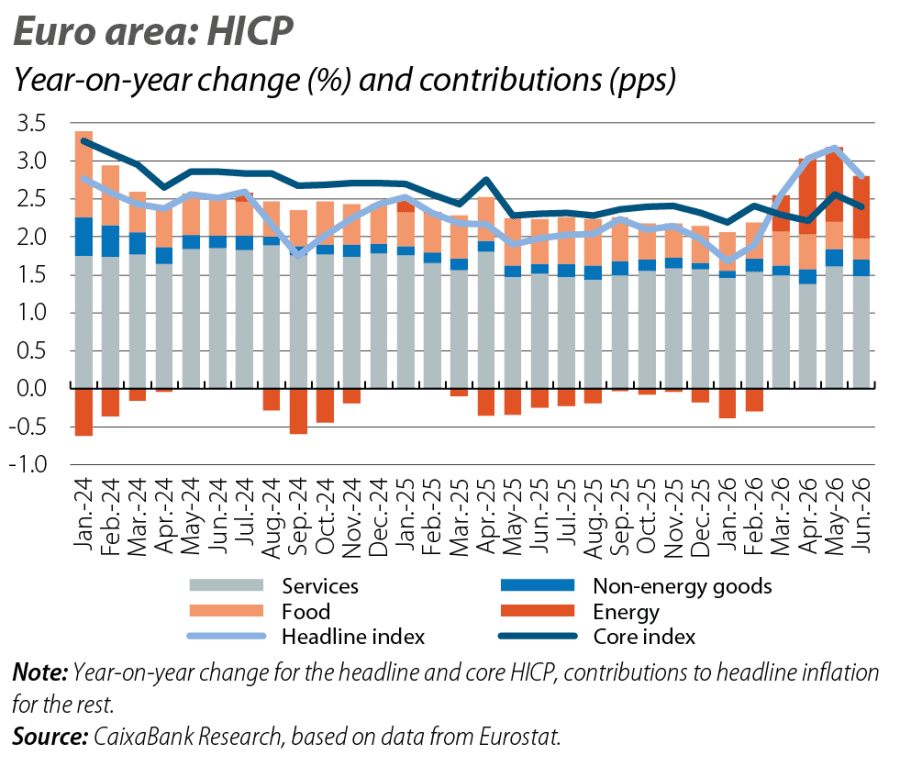
Energy costs have risen by around 10% in recent months, driven by fuels, which have experienced price increases of over 20% year-on-year, while the electricity CPI has been much less strained (with inflation close to 3% year-on-year). This has added 1 pp to headline inflation in the euro area and almost entirely explains the change in level since February (see first chart). Although the figures are much lower than the stress experienced in 2022 (when energy inflation peaked at 40%), the magnitudes are significant enough to spread to other prices through indirect effects (increased input costs).1 The spillover could also have second-round effects (wage-price spiral), although such effects appear with a delay and it is too early to observe them in the available data.
- 1
See the Focus «Energy tensions, inflation and monetary policy in the euro area», in the MR04/2026.
Indirect impact: mixed evidence
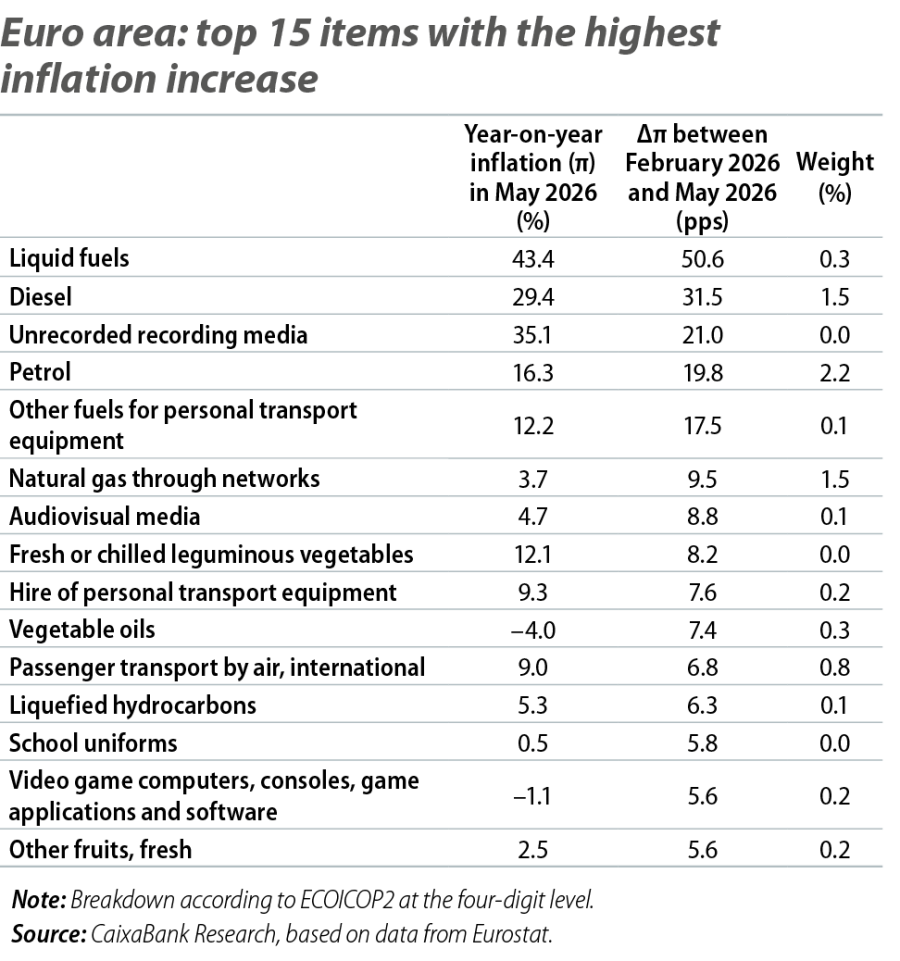
The detailed breakdown of the price index provides the first clues about the extent of the indirect effects so far. On one hand, a breakdown of the HICP into nearly 300 products (see table) clearly shows that the bulk of the current inflation spike is purely energy-related. However, some spillover to energy-intensive goods and services, such as audiovisual media or various transport services, is apparent.2
- 2
These products are identified as energy-intensive based on the analysis of input-output tables referenced in footnote 1.
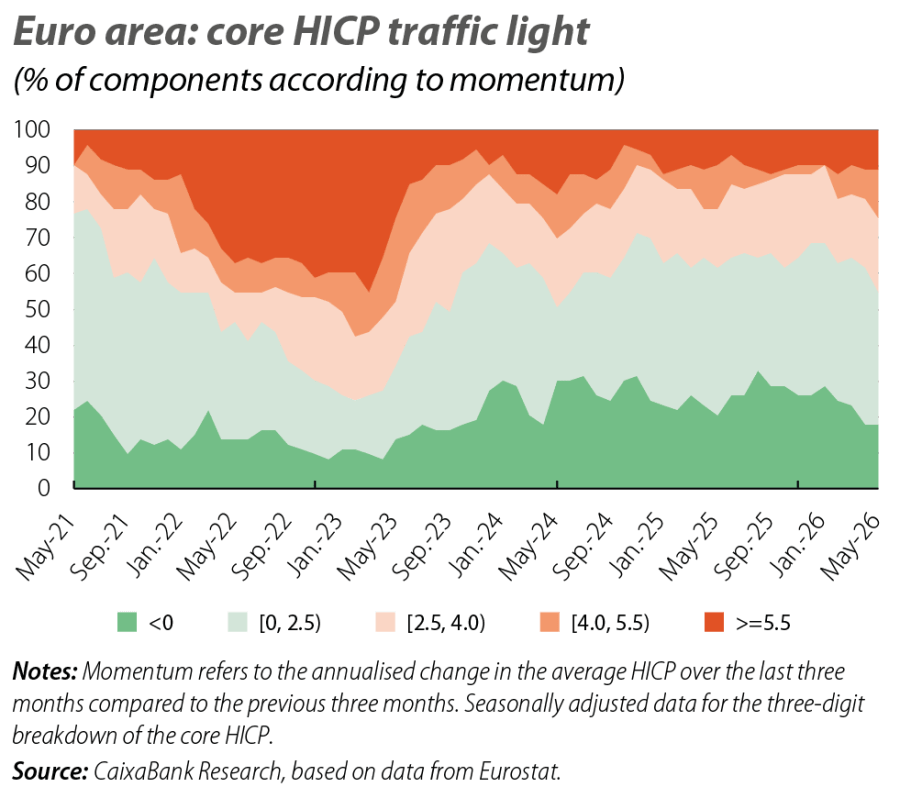
On the other hand, if we focus on more real-time inflationary measures, such as momentum,3 there are also some signs of indirect effects. Specifically, as shown in the second chart, although the vast majority of goods and services continue to have momentums below 2.5%, the share of products in the core basket4 with momentums exceeding 4.0% has increased from 10% to 25% so far this year.
Another way to assess the indirect effects of the energy shock is to build an inflation indicator that includes all the non-energy goods and services that are most likely to experience spillover effects from energy. Based on the energy intensity of each productive sector in the euro area, which we can infer using input-output tables, we have classified all non-energy goods and services that make up the HICP into «energy-sensitive» and «non-energy-sensitive»: making up approximately 30% and 70% of the core basket, respectively.5 As shown in the third chart, during the inflation crisis of 2022-2023, the «energy-sensitive» indicator predicted the stress and easing in other underlying prices. Although current movements are much smaller compared to 2022-2023, between February and May 2026, «energy-sensitive» core inflation rose by 0.4 pps, while the «non-energy-sensitive» index remained stable.6
- 5
We reproduce the methodology used by Fagandini et al. (2024), «Decomposing HICPX inflation into energy-sensitive and wage-sensitive items», ECB Economic Bulletin 3/2024, but using a slightly less detailed breakdown of the HICP (3 digits, with 103 items) and the latest weightings (2026). A particular good/service is considered «energy-sensitive» when its energy intensity (intermediate energy consumption over total production) is higher than the average for all goods/services.
- 6
The «energy-sensitive» index shows two recent sawtooth patterns,in April 2025 and 2026, attributed to calendar effects related to Easter (with a significant base effect on passenger airfares and holiday packages).
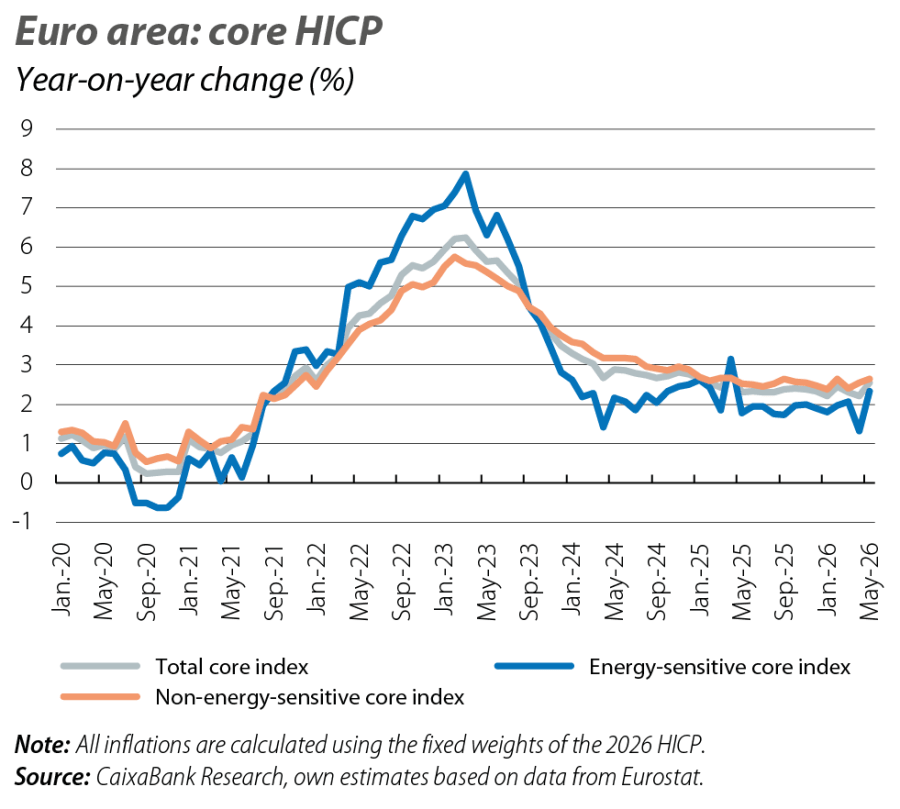
This review of different segments of the HICP, which is the benchmark index and the most relevant metric for the ECB, shows some indirect effects, although they are still somewhat incipient (more visible in momentum than in year-on-year rates of change) and of limited magnitude. There are other indicators besides the HICP that do make the threat of indirect effects more visible. These are primarily indicators based on business surveys such as the PMIs or the European Commission’s sentiment indicators. Since March, these indicators have reflected sustained pressure on input costs and intentions to raise prices for final products. Moreover, Eurostat’s production price data indicate certain pressures in capital goods (+2.1% in April vs. 1.6% in January-February), intermediate goods (3.9% vs. 1.4%) and durable consumer goods (2.7% vs. 2.3%). Finally, food inflation has eased in the euro area in recent months (from 2.5% in February to 1.6% in June). However, these prices are not without future risks, especially given the rising cost of key inputs such as fertilisers (although fertiliser prices fell sharply in June following the US-Iran agreement).
What about the US-Iran agreement?
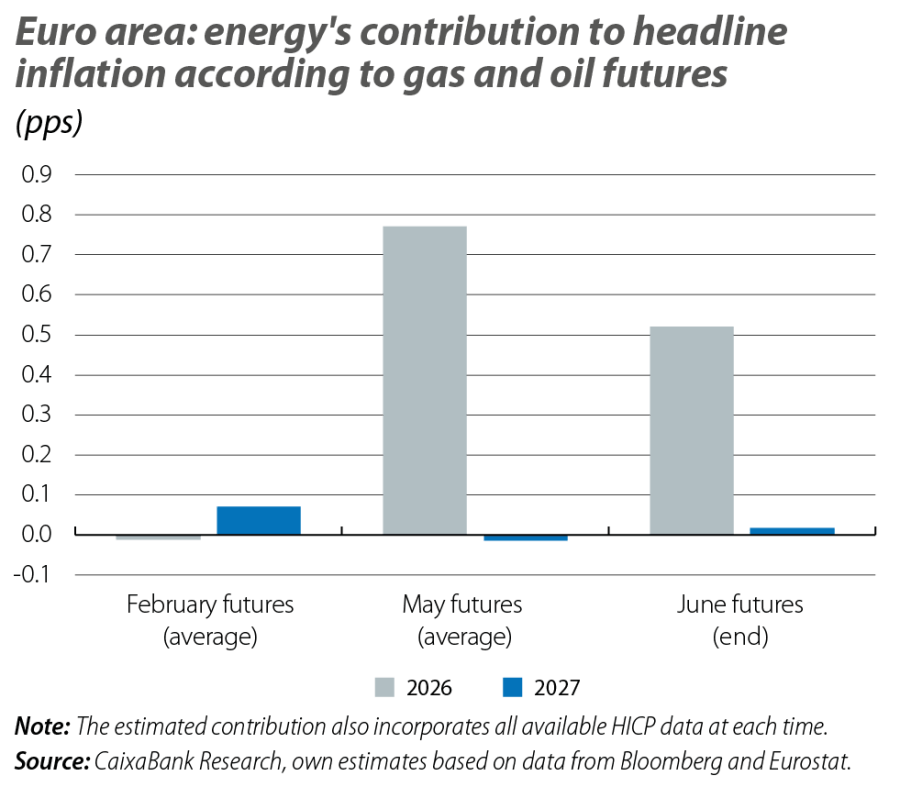
In mid-June, oil and gas prices fell sharply due to the memorandum of understanding announced by the US and Iran, which marked a continuation of the military truce and the announced reopening of the Strait of Hormuz together with a 60-day negotiation window. Geopolitical uncertainty is high, but if the markets continue to react favourably, the inflationary threat from the conflict could be significantly reduced: according to oil and gas futures prices at the end of June, the direct impact of energy on headline inflation in the euro area in 2026 could be reduced by around 30% (see last chart).7 Even in these favourable scenarios, euro area inflation could average close to 3% in 2026, but it would be «slightly below» rather than «slightly above». With a lower risk of adverse scenarios, the likelihood of significant price spillovers would also decrease, boosting confidence in a return to 2% during the course of 2027.
- 7
This direct impact is estimated using linear regressions which transfer oil and gas futures to the HICP of fuels and lubricants and to the HICP of energy excluding fuels, respectively.
Geopolitics
We analyse the major geopolitical trends and thier effects on the financial markets and the economy.