
The price of not building: how the housing deficit explains much of the price pressures
In recent years, the rise in house prices has intensified, becoming one of the main economic and social concerns in Spain. This phenomenon is largely explained by the housing deficit that has accumulated since 2021 due to a persistent gap between supply and demand. This housing deficit is significant (we estimate it amounts to around 4% of the stock of primary homes in Spain), and higher in certain provinces, major cities and tourist areas: precisely where we find the greatest upward pressures on prices.

House prices in Spain have accentuated their upward trend in recent years, reflecting an increasingly stressed market. This price rally is largely explained by a housing deficit driven by a persistent imbalance between a still inadequate supply and a demand that remains highly dynamic. On the supply side, although the construction of new homes is gaining traction, the current levels remain low in historical terms. At the same time, demand has been driven by intense demographic flows – with strong net household creation – the purchase of housing by non-resident foreigners and the rise of alternative uses such as tourist or temporary rentals, which reduce the availability of ordinary housing. In this article, we estimate the housing deficit that has accumulated between 2021 and 2024 by province, and we analyse its relationship with the growth of house prices.
Estimating the accumulated housing deficit between 2021 and 2024 for Spain as a whole
To quantify the housing deficit in Spain between 2021 and 2024, three complementary approaches have been used. The first compares new construction permits with the net creation of households; the second, the number of completed homes with said net household creation, and the third adjusts the estimate a little more by discounting those homes that are allocated for tourist use and those acquired by non-resident foreigners.9 These approaches should be understood as being illustrative estimates, each with the aim of refining the calculation of the deficit a little further, even though they remain imperfect estimates.
- 9
All variables have been calculated as cumulative flows over the four-year period. The data on households are derived from the Continuous Population Statistics published by the National Statistics Institute (INE). We use the hypothesis that 50% of sales to non-resident buyers are purchased from other non-resident sellers and therefore should not be subtracted from the stock of housing available to residents. Unfortunately, no information is available on the percentage of the housing stock that is owned by non-resident foreigners. We do not incorporate any estimate for temporary rental homes, as sufficient information is not available. On the other hand, the demand could be underestimated because unformed households are not taken into account, precisely because of the difficulties in accessing housing.

According to the first estimate, the housing deficit accumulated over four years amounts to around 515,000 homes, and this figure rises to around 600,000 if we consider finished homes (rather than permits granted) and to 765,000 if homes set aside for other alternative uses are also subtracted.10 This is equivalent to 4.0% of the stock of primary homes in 2024 and represents around 80% of all the net households created. In other words, after discounting other uses, the volume of new available housing would only have been able to accommodate 20% of the net households created, meaning that other households resided in second homes converted into primary ones.11
- 10
According to the National Statistics Institute (INE), the increase in the number of homes used as tourist accommodation between August 2020 and May 2025 amounts to some 60,000 homes. According to the Ministry of Housing and Urban Agenda (MIVAU), the number of home sales to non-resident foreign buyers amounted to a total of 218,000 units over this period. We consider half of these homes in the deficit calculation (3).
- 11
Note that this calculation does not imply that the newly-formed households occupy the newly-built homes or the second homes that are converted into primary residences. The high turnover in the existing-home market suggests that the market dynamics are more complex.
Between 2021 and 2024, a deficit of up to 750,000 homes accumulated, largely covered by second homes converted into primary residences
This is revealed by data on changes in the stock of primary and non-primary homes published by the Ministry of Housing and Urban Agenda (MIVAU): between 2020 and 2024 there was a significant transfer from the stock of non-primary homes in favour of primary homes. Specifically, the number of primary homes increased by 741,000 in these four years; of these, 360,000 came from the stock of non-primary homes and 381,000 were new additions to the housing stock. Therefore, much of the housing needs of recent years have been met by converting a portion of the stock of second homes into primary residences, as shown in the following chart.
The housing deficit is concentrated in urban and touristic provinces, where supply has not kept up with population growth and tourist demand
The data by province show that much of the housing deficit accumulated between 2021 and 2024 is highly concentrated: the top four provinces in the ranking account for between 40% and 50% of the deficit, depending on the indicator used, and the top 10, around two thirds. In contrast, the 20 provinces with the lowest deficit account for only 5% of the total (see table on page 17).
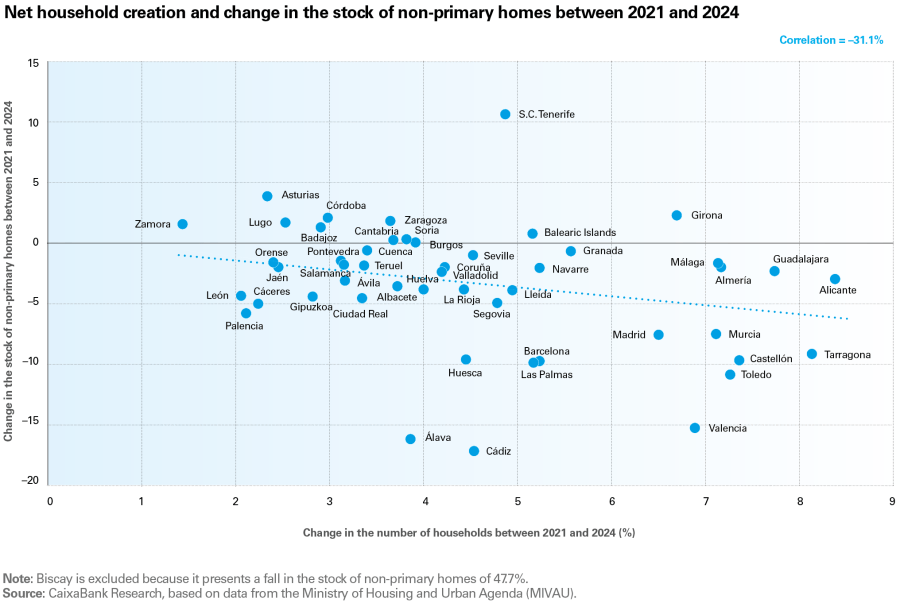
It is no surprise that Madrid, Alicante, Barcelona, Valencia and Malaga are the provinces that lead the ranking, as it is urban and touristic areas that have experienced the greatest pressure on demand, while the supply of housing in these locations has failed to match this demand. There is also a negative relationship between net household creation and the change in the number of non-primary homes (see chart below). In other words, it is in the provinces with greater population pressure that we observe a more pronounced trend of transfers from secondary to primary homes, and this also suggests that the pace of construction of new homes in these locations is insufficient. In these provinces, the level of utilisation of the housing stock has increased substantially in recent years. In the future, this lever – converting secondary homes into primary ones – may have less scope to relieve demographic pressures.
At the other end of the table, we find the provinces associated with Spain’s depopulated or «emptied» areas, such as Soria, Palencia, Cáceres, Zamora and Teruel. These provinces are characterised by very small population growth rates. Thus, despite the limited constructive dynamism, the accumulated housing deficit represents just 1%-2% of the housing stock. In any case, it should be noted that even in these provinces a certain housing deficit has accumulated, with only a few exceptions (shaded in green in the table on the following page).

The impact of the deficit on house prices
By province, the correlation between the housing deficit and house price growth between 2021 and 2024 is positive with all measures (both in absolute terms and as a percentage of the stock of primary homes). This result suggests that the impact of the accumulated housing deficit on prices is by no means negligible. A simple regression of house prices over the accumulated deficit suggests that for every 1-pp increase in the deficit, prices grow by around 0.6 pps more per year on average. Using this correlation as a benchmark, the total national accumulated housing deficit (765,000 homes, equivalent to 4.0% of the stock of primary homes) would explain 2.3 pps of the annualised price growth of 6.0% registered between 2021 and Q4 2024. That is, the accumulated deficit would explain 39% of the price increase observed in the national total. Put another way, according to this estimate, without the pressures caused by the accumulated housing deficit, house prices across Spain as a whole would have increased by 3.7% per year on average, rather than the 6.0% rate observed.
The accumulated housing deficit could explain up to 39% of the recent increase in prices
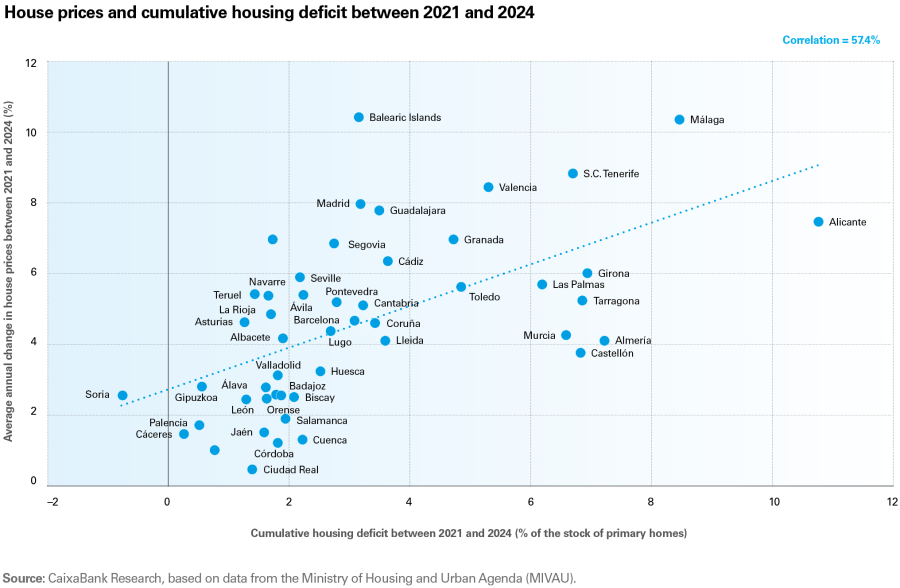
In the above chart, we can observe that the provinces with the highest deficit are those that experienced the greatest increase in house prices, such as Alicante, Malaga and Santa Cruz de Tenerife. On the other hand, the case of the Balearic Islands stands out, being the province that experienced the greatest increase in prices (10.4% per year on average), very similar to that registered in Malaga, even though the estimated accumulated deficit is not particularly high (only 3.3% of the stock of primary homes, below the national average). This could be due to the influence of other factors that are driving the price rally in the Balearic Islands (such as the appeal of the luxury segment, among others). In addition, the deficit measure used could be underestimated: for example, those households that have not formed precisely because of the housing affordability issue are not taken into consideration. Such a trend would result in low emancipation rates among young people still living with their parents and difficulties for companies in finding workers who can move to the islands.
In conclusion, this simple exercise merely illustrates how the accumulated housing deficit in recent years could be significantly affecting the evolution of house prices in Spain. Current population projections point to strong housing demand in the coming years, underscoring the need to significantly boost housing construction in order to prevent the current price pressures from escalating.