
What does the growing dispersion of prices tell us about the housing market?
In the current expansionary cycle of the Spanish real estate market, there is a marked increase in the dispersion of house prices across the country, unlike in the real estate boom prior to 2008. Since 2015, tourist municipalities and large cities have led the growth in prices. In contrast, rural areas and small towns have experienced more moderate price increases. This behaviour reinforces the view that, in this cycle, price formation is responding to the specific supply and demand dynamics of each area. In major cities, the strong price pressures in the centres are spreading to increasingly municipalities in the metropolitan areas.

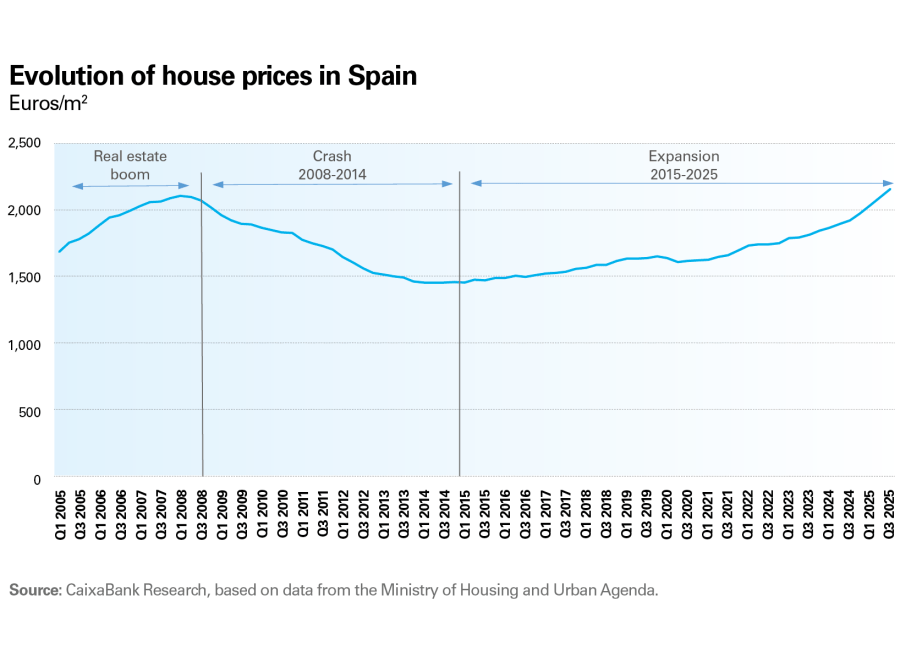
In the last 20 years, the dynamics in the level and dispersion of prices in Spain’s real estate market allow us to distinguish three key phases:
The boom of 2005-2008: during this period there was a significant increase in prices and a decrease in dispersion. In the final stages of that cycle, the price increases spread geographically, regardless of the supply and demand dynamics in each area. Between 2005 and 2007, despite supply growing faster than demand – with an average of 748,000 new construction permits granted annually, almost double the net household creation – prices rose rapidly and across the board. These increases, therefore, became detached from the supply and demand dynamics of each locality and mainly responded to a feedback loop of appreciation expectations.
The crash of 2008-2014: beginning in 2008, there was a sharp drop in prices, accompanied by increased dispersion: cities with higher prices experienced less pronounced declines, while other areas where there had been an oversupply and where the price rally during the boom was not justified by the fundamentals suffered greater setbacks.
The expansion from 2015 onwards: there has been a sustained increase in prices
– only briefly interrupted during the pandemic– and a marked widening of price dispersion. This period is characterised by a supply deficit in certain specific areas. While net household formation has exceeded 130,000 per year, fewer than 97,000 new construction permits have been issued per year. This gap, as explored in the article «Lack of new housing where it is most needed: a growing and geographically concentrated deficit», has worsened in recent years: leading to particularly strong price increases in markets with strong demand and relatively limited supply, such as tourist areas and large cities.
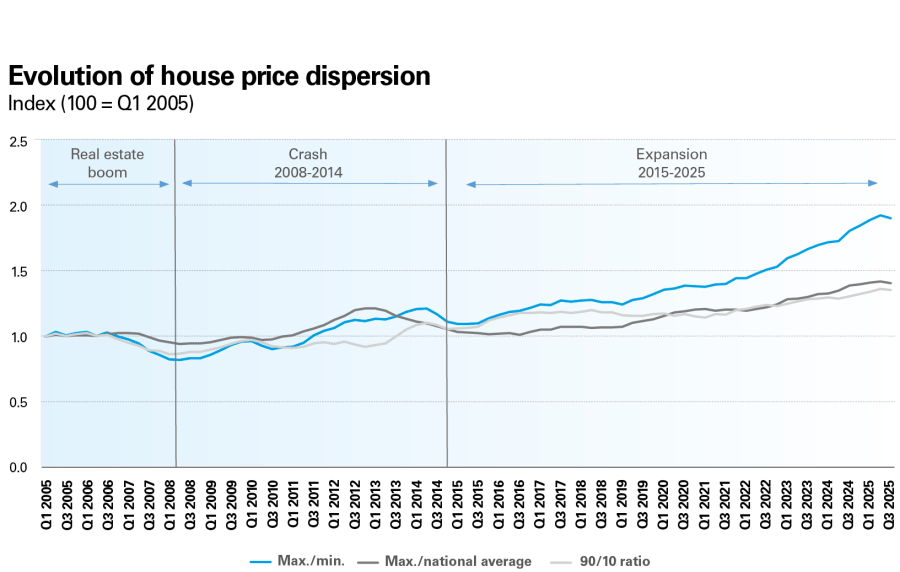
The pattern of a continued increase in price dispersion is evident in various metrics, such as (i) the ratio between the municipality (>25,000 inhabitants) with the highest price and the one with the lowest price; (ii) the quotient between the most expensive municipality and the national average, and (iii) the quotient between the 90th percentile and the 10th percentile. All of them describe the same profile: a reduction in dispersion during the real estate boom, an increase during the crash of 2008-2014, and strong growth in dispersion during the expansion that began in 2015.
In this article, we analyse the factors that have driven these trends, focusing on the role of tourist municipalities and city size, and examining price dynamics within the metropolitan areas of Barcelona and Madrid.
Tourist municipalities lead the growth of house prices in Spain
Tourist municipalities5 have recorded a higher price level than non-tourist ones, and the gap between them has widened substantially between 2005 and 2025, increasing from 42.1% to 85.7%.
The cyclical analysis further suggests that this divergence is not so much explained by the pre-2008 boom or the subsequent adjustment, but mainly by the expansionary phase that began in 2015. Since 2015, prices have risen by 105.2% in tourist municipalities, compared to 66.6% in non-tourist ones. In the previous phases, the trajectories were more similar: during the boom of 2005-2008, growth was even slightly higher in non-tourist municipalities (28.2% compared to 23.4%), while in the 2008-2014 period, tourist municipalities experienced a less severe decline (–40.0% compared to –45.5%).
- 5
We classify municipalities as either tourist or non-tourist based on the percentage of tourist expenditure in the municipality relative to the total expenditure recorded on CaixaBank POS terminals in the municipality. If domestic and international tourist expenditure account for 10% of the total expenditure in the municipality, it is classified as a tourist municipality.
This pattern reinforces the view that the price rally in the post-2015 cycle has been largely driven by idiosyncratic factors in each area. Tourist municipalities have higher demand, stemming from both residential uses (households with higher income, second homes) and uses linked to tourism activity (accommodation, investment for business use, higher turnover in demand). When this demand pressure is combined with a supply that has been slow to adapt – due to land restrictions, regulation, construction times, or physical limitations in coastal areas – the result has been a more intense and persistent price increase than in the rest of the country.
Major cities lead the growth in house prices in Spain
When segmented by municipality size, we note significant differences in both price levels and growth rates. Barcelona and Madrid have the highest prices and growth rates, followed by cities with more than 200,000 inhabitants. In contrast, cities with populations of between 25,000 and 200,000 exhibit price levels and growth rates similar to the national average.
The dispersion of house prices by municipal size reflects a differentiated pattern in each of the phases of the cycle analysed. During the boom of 2005-2008, Madrid and Barcelona grew less (21.0%) than cities with more than 200,000 inhabitants (26.5%) and smaller cities (25.8%). However, during the 2008-2014 adjustment, the major cities experienced more moderate declines, and since 2015 they have led the expansion. Specifically, in this last period, Madrid and Barcelona have seen an average increase of 95.6%, approximately double the national average of 47.7%, and above that of other sized cities. This gap indicates that, in this latest cycle, we are observing stronger price increases where demand is more robust and supply is slower to adapt, resulting in significant housing deficits. This reinforces the interpretation that current house price dynamics are being driven by the differing evolution of supply and demand in each area.
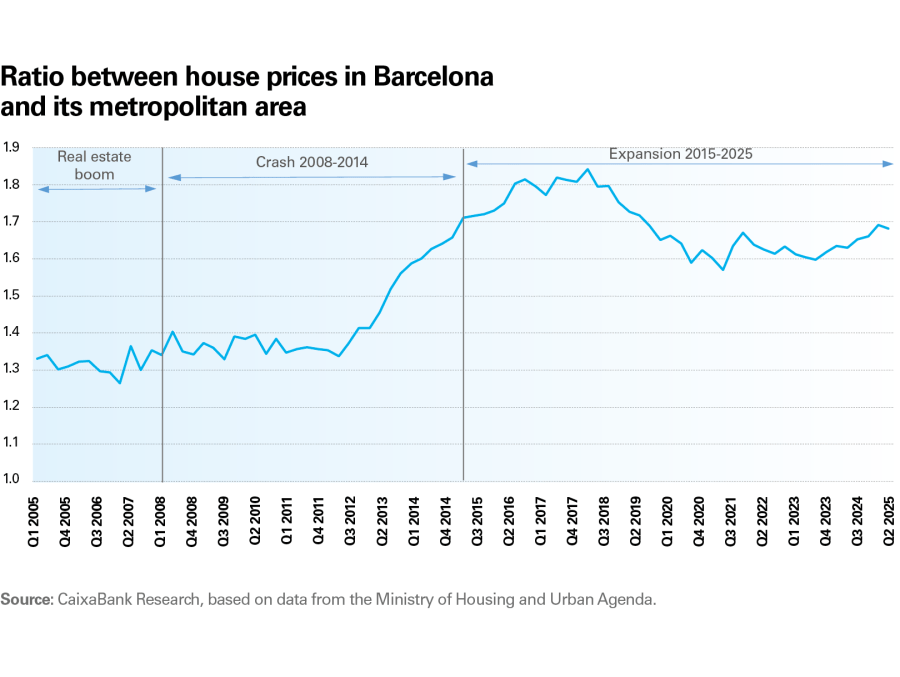
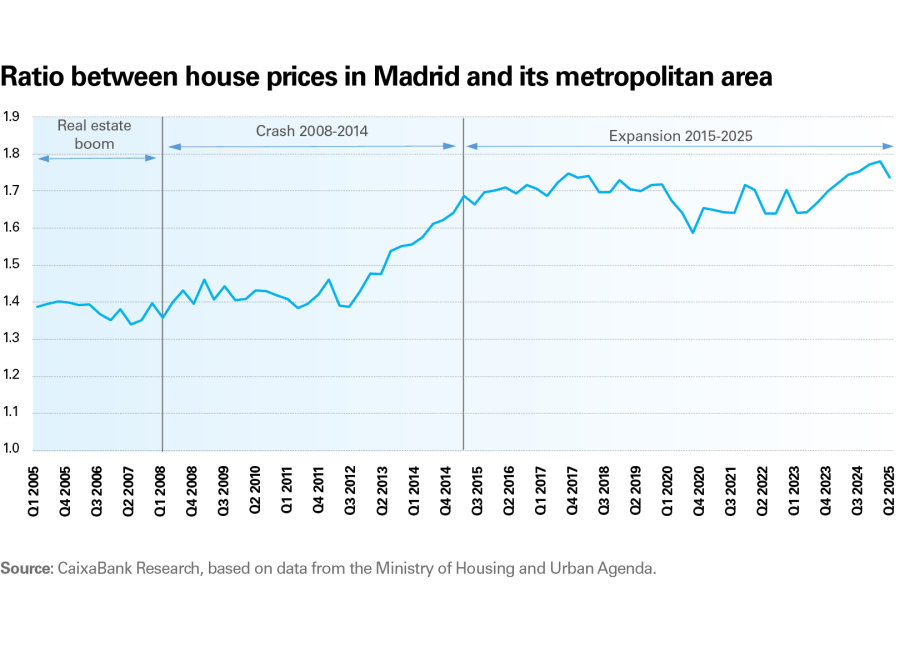
Price gaps between the centres of large cities and their outskirts are not yet narrowing
Both during the pre-2008 real estate boom and the crash of 2008-2014, the metropolitan areas of Barcelona and Madrid followed the price trends of their centres with a slight delay. In the final years of the boom, prices first slowed in the cities of Barcelona and Madrid. Prices also bottomed out more quickly in the cities, which started recovering more quickly than their metropolitan areas. This pattern is consistent with a logic of spatial diffusion: changes in demand and financing conditions initially affect the prime markets and those with more transactions, and then spread to the surrounding municipalities as the deterioration of affordability in the urban centre eventually shifts demand towards the metropolitan rings, where housing is more affordable.
In the current expansionary cycle, the general pattern remains, albeit with some nuances. During the pandemic, the declines recorded in the city centres were faster and more intense, reflecting a temporary shock to residential preferences and mobility. However, since the beginning of 2024, prices in Barcelona and Madrid have once again grown faster than in their respective metropolitan areas. Moreover, although in the last two quarters price growth in the metropolitan area has approached that of the centres, prices in the major cities remain significantly higher than those in their metropolitan areas from a historical perspective. This may suggest that in the coming years, price pressures could be more intense in the municipalities of the metropolitan rings.
In the current expansionary cycle, the pattern of price dissemination remains, albeit with significant nuances