European productivity from a regional perspective
The new CaixaBank Research Dossier, dedicated to «An analysis of European productivity», aims to explore the recent dynamics in the EU’s productivity, focusing on its territorial dispersion and the differentiating factors between the best and worst performing regions. In this first article, we provide some context by outlining the main trends.
The Draghi report is flooded, even in its preamble, with references to the persistent productivity gap with the US, the low productivity growth in the EU, and the need to boost it in a context of a rapidly ageing population.1 Thus, a sustained and higher increase in productivity has become a top priority for the European economy, as it would simultaneously allow for an improvement in citizens' purchasing power, help mitigate the effects of the demographic transition – including the sustainability of public finances –2 as well as help maintain a minimum level of economic relevance in the new global geopolitical scenario. In this Dossier, we explore recent dynamics in the EU’s productivity, focusing on its territorial dispersion and the differentiating factors between the best and worst performing regions. We begin with some context by outlining the main trends.
- 1
European Commission (2024), «The future of European competitiveness».
- 2
See the Dossier «Challenges and policies in the age of longevity» in the MR09/2025.
A broadly unfavourable diagnosis, from any perspective
The debate around what productivity is and how to measure it would probably fill an entire Dossier, so it is worth specifying from the outset which metrics we will use as a reference here and in the following articles. We opt to use GDP per hour worked, as it is considered a relatively uniform measure of production capacity (value added generation) per unit of working time. It is also less sensitive to the cycle than productivity per employee – as seen during COVID-19 – and is easily observable compared to the complications involved in estimating total factor productivity (TFP).3 Moreover, GDP per hour worked is the metric which, according to the Draghi report, goes further in explaining the differences in per capita income between the European economy and the US. As for its measurement, we use statistics in real terms to analyse its evolution over time and abstract from the impact of prices, and when making a cross-sectional snapshot between EU Member States or regions, we adjust the nominal values for differences in purchasing power parity in each territory. In this way, our goal is to achieve the best possible approximation to a tangible idea – such as physical goods or services provided – rather than one based on monetary concepts or productivity.
- 3
Changes in total factor productivity measure the variation in production in an economy that is not explained by increases in factors of production (capital and labour) – e.g. through a more efficient use of these factors.
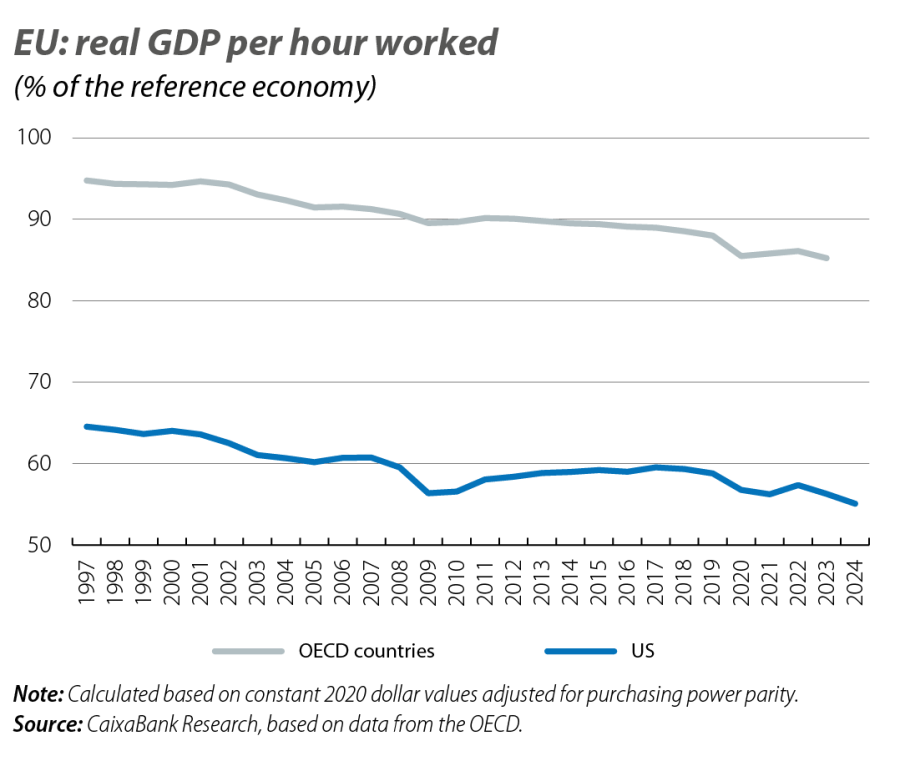
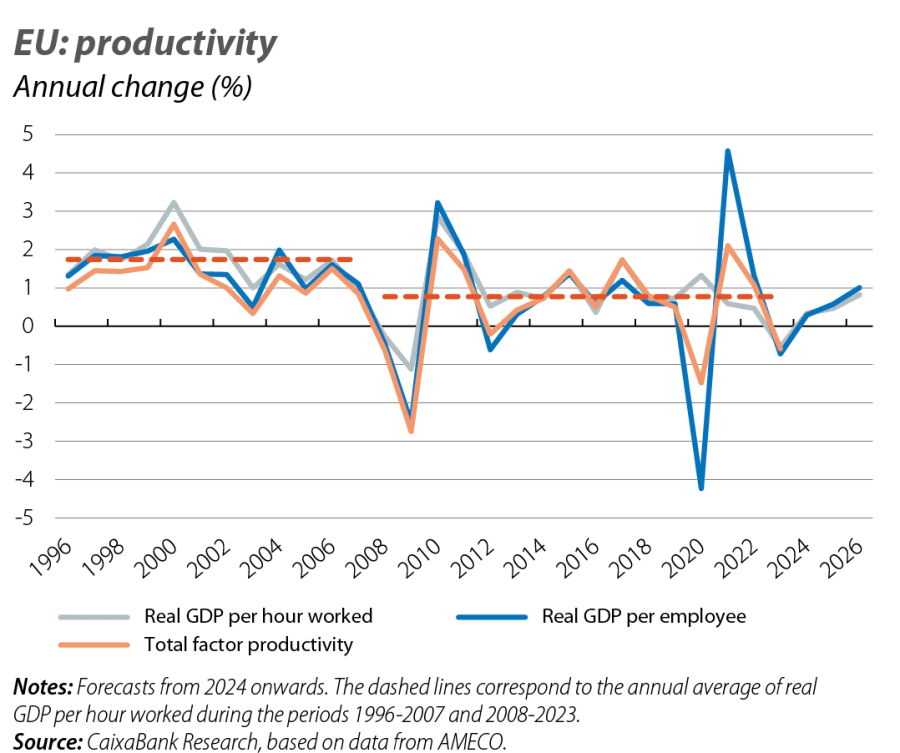
The debate around metrics quickly takes a back seat when we find that they all lead us to a similar diagnosis and, more importantly, one that is not favourable for the aggregate productivity of the European economy. Thus, real GDP growth per hour worked in the EU has shown a notable slowdown over the past 30 years, decreasing from an annual average of 1.7% in the period 1996-2007 to 0.8% in 2008-2023, and falling below 0.5% since COVID-19 (see first graph). Productivity growth since the Great Recession is also less than half of that observed in the previous decade if we look at the figures in terms of GDP per employee or TFP. The comparison with other developed economies does not reflect well on European productivity either (see second chart). According to OECD estimates, GDP per hour worked in the EU would today be equivalent to 85% of the value for this group of economies, compared to 95% in 1995. Moreover, it would have followed a similar trend relative to the country considered to be the technological frontier, the US, decreasing from 65% to 55% in the same period.4
- 4
Calculated using constant 2020 USD values adjusted for purchasing power parity.
Wide geographical disparity that is slowly narrowing
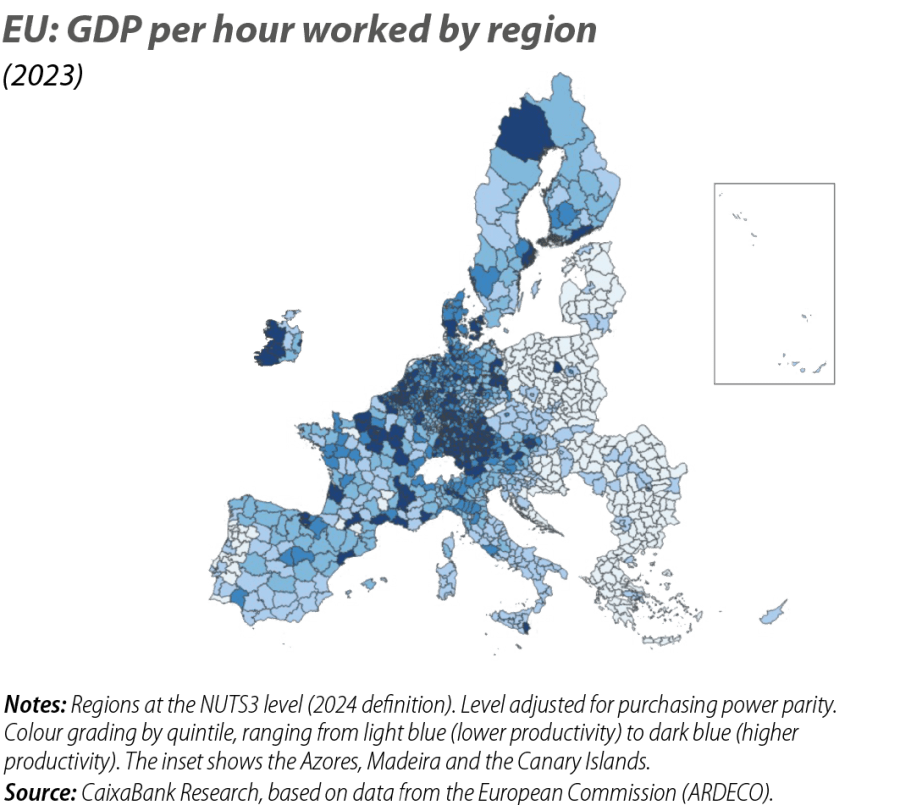
The data for the EU as a whole, or even within the Member States, conceal highly disparate realities between territories.5 As a starting point for the more in-depth analyses presented in other articles of this Dossier, we introduce here a general overview of the regional differences in productivity levels and the recent dynamics. We take as a reference the most detailed territorial division defined by Eurostat, known as NUTS3, which covers approximately 1,165 territorial units across the 27 countries that make up the EU. In the case of Spain, this corresponds to the provinces and autonomous cities.
With data for 2023, the geographical distribution shows a concentration of territories with higher productivity in the central and northern areas of the EU, while the lowest values are recorded in countries in the east and south (see map). Specifically, among the NUTS3 divisions where GDP per hour worked is at least 25% higher than the EU average, a significant number of regions are found in Ireland, Denmark, Germany, Belgium, France, and Austria. Conversely, among those with productivity at least 25% below the average, we find a majority of territories in Bulgaria, Greece, Poland, Portugal, Croatia, Hungary and the Baltic republics.
- 5
O. Aspachs and E. Solé (2024), «Evolución de la productividad en Europa: una mirada regional», Cercle d’Economia.
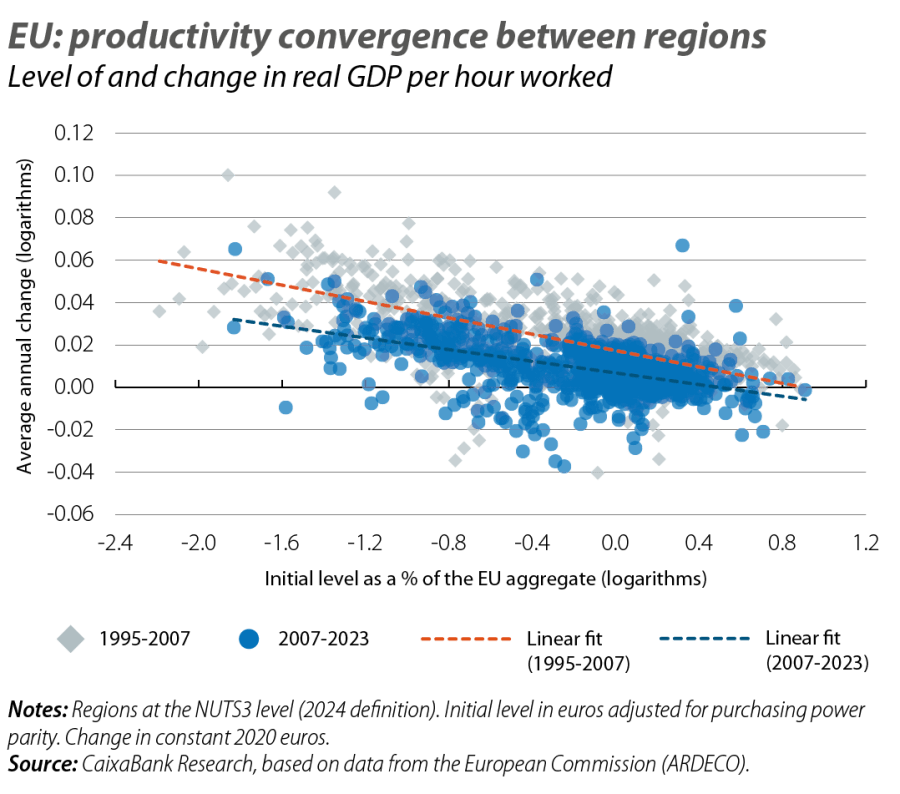
In light of this snapshot of differences in productivity levels, which confirms the persistence of significant territorial disparities within the EU, it is worth assessing the extent to which there has been convergence between regions of lower and higher productivity. Based on the two periods previously identified either side of the Great Recession, we compared the GDP per hour worked in the first year of each period with the average annual change (see third chart). From this exercise, we can draw three conclusions. The first, already noted above in aggregate terms and clearly visible in the chart due to the downward slope revealed by the scatter chart, is that productivity growth has been lower on average since 2008, with a greater number of regions with declines in GDP per hour worked. The second, reflected in a greater number of points located away from the dashed line marking the average pattern, is that the degree of dispersion in productivity change appears to have increased significantly for the same starting level; this would suggest a greater role of more idiosyncratic factors in the evolution of the different regions. The third conclusion, illustrated by the change in the slope of the dashed lines, is that the rate of convergence has also significantly decreased in the second period; i.e. the regions with lower productivity continue to grow faster than the rest, but to a lesser extent.
Greater convergence is needed in order to close the gap with the US
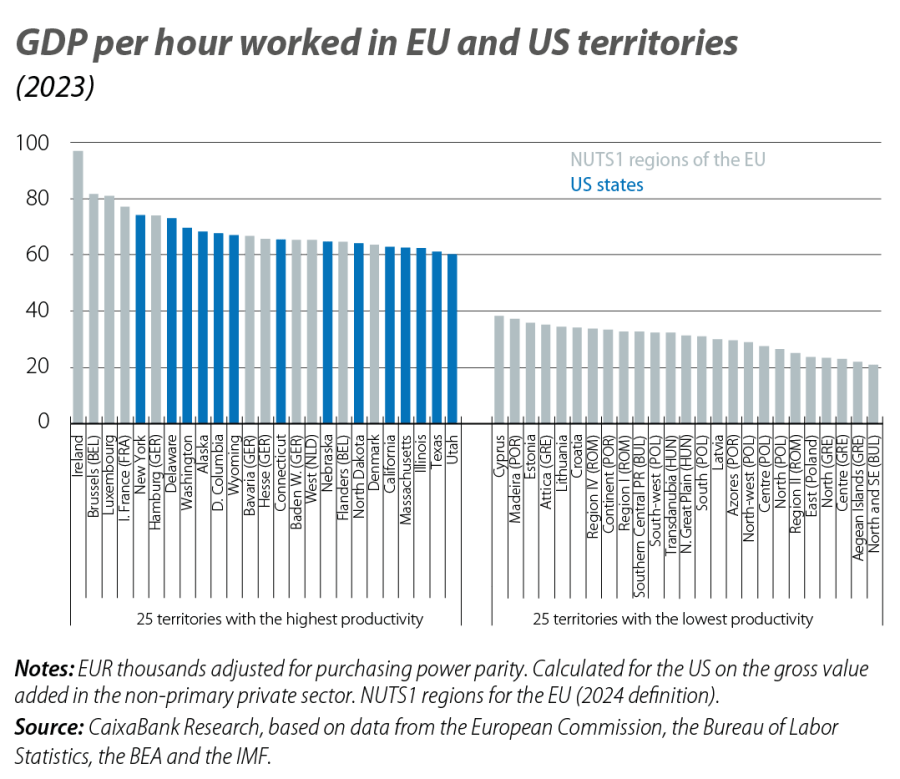
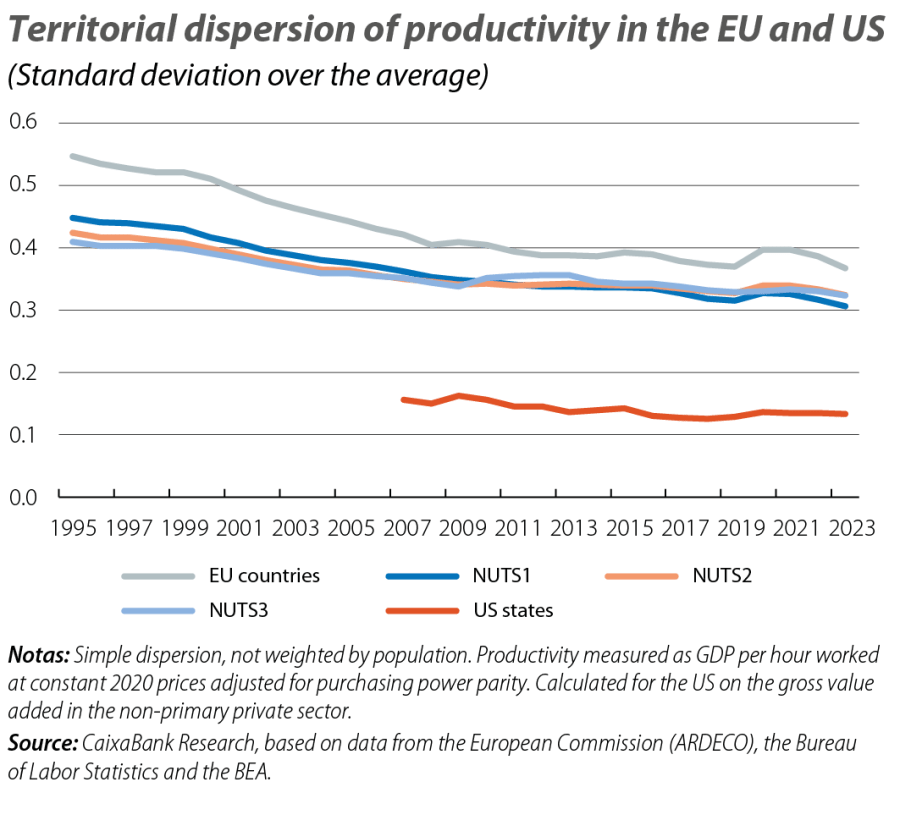
Parallels are often drawn between the EU and the federal structure across the Atlantic. Productivity is no exception, and better understanding its territorial differences can give us clues about which levers to activate in the European economy in order to close the persistent gap with the US. When comparing the dispersion between countries and regions of the EU with that of the US states, we find that the territorial map of productivity is much more even in the latter (see fourth chart). This diagnosis is robust to the use of different territorial units in the EU and would even hold if we used figures not adjusted for differences in price levels between US states.
The result of this greater dispersion among European regions, along with a lower average productivity than in the US, suggests that a significant number of territories must be far from the technological frontier. This conclusion is confirmed when we compare the levels of GDP per hour worked in US states with those of the most similar territorial units in the EU, the so-called NUTS1 divisions (large socio-economic regions with between 3 and 7 million inhabitants, or entire countries where applicable). Thus, while among the 25 territories with the highest productivity – out of a combined total of 143 – we find a relatively equitable distribution between both economic areas (something that is replicated in the middle part of the distribution), the 25 lowest records correspond to European regions, mainly in the east and south of the EU.
Understanding how we can accelerate convergence between EU territories – learning from the regions that show better performance and what would allow us to reduce the gap with the US – is precisely what we dedicate the following articles of this Dossier to.