
The new (im)balances in the oil market
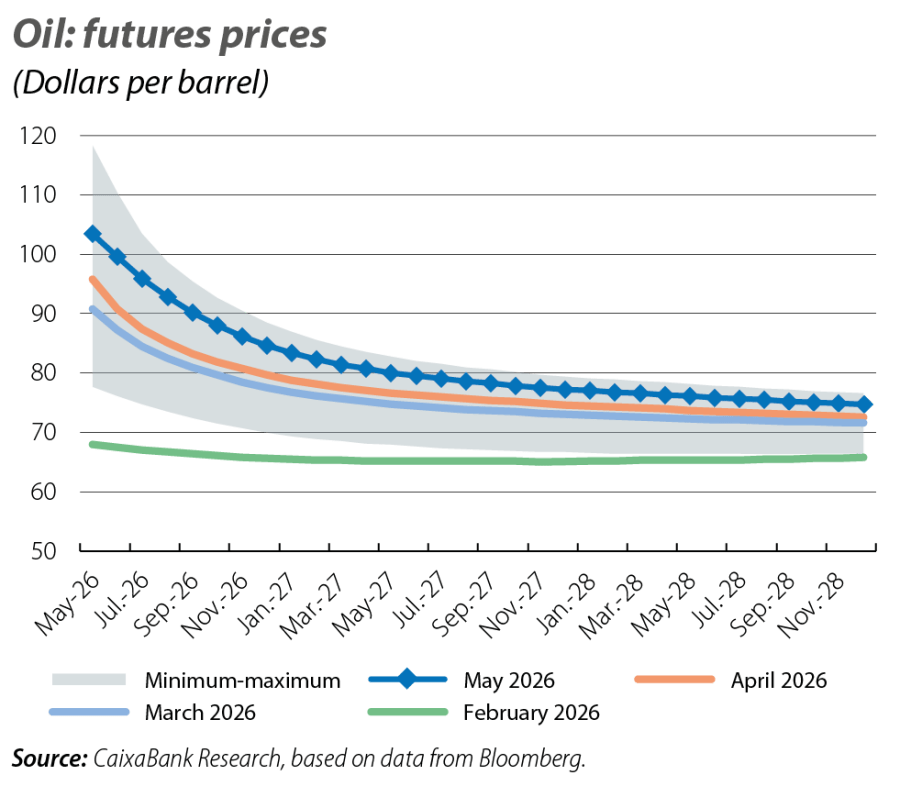
Despite futures contracts indicating structurally higher oil prices in the coming years as a result of the biggest oil shock in history, markets also seem to be assuming a rapid normalisation of supply and demand conditions in the coming months.

As a result of the conflict in the Middle East and the near-total closure of the Strait of Hormuz over the past three months, the price of oil averaged around 103 dollars per barrel in May. Meanwhile, futures contracts maturing in 6-12 months have fluctuated between 80 and 95 dollars per barrel, maintaining a steeply negative price curve.1
- 1
The negative slope indicates that contracts for shorter-term deliveries are priced significantly higher than those for long-term delivery. This pattern, known as «backwardation», indicates that buyers are willing to pay a premium to secure short-term oil deliveries and is a sign of supply shortages (or exceptionally high oil demand). It also indicates that the market expects the imbalance between supply and demand to be temporary, discouraging the storage of oil since it will
be worth less in the future than it is now.
The black gold market: from solid fundamentals to a fluid world
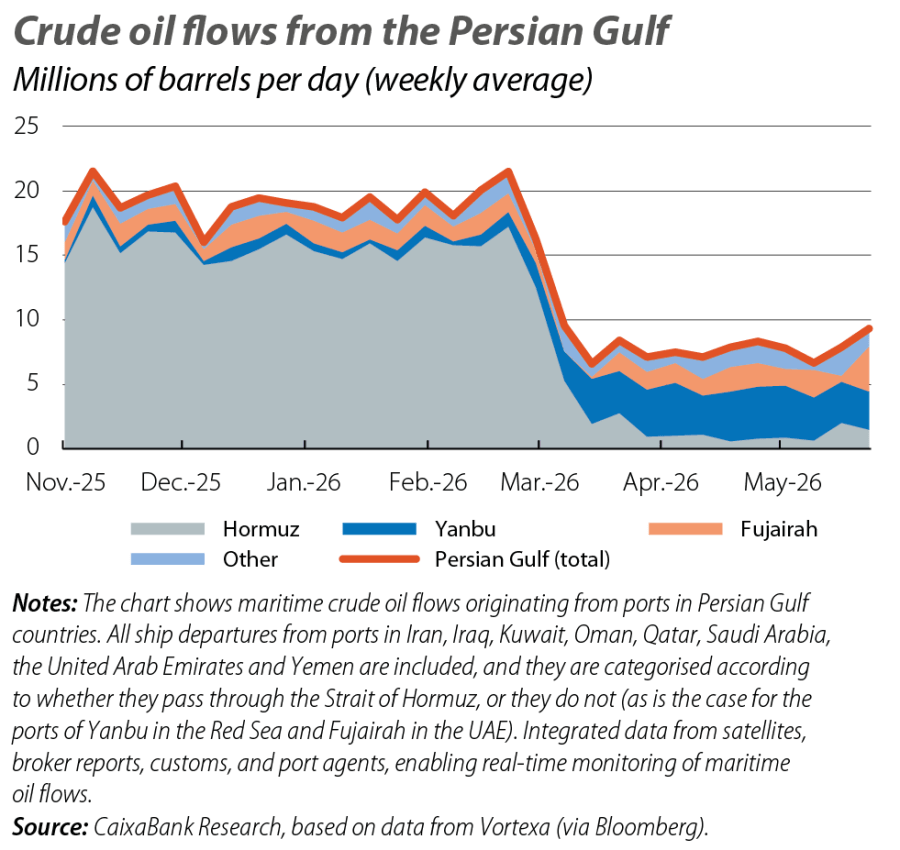
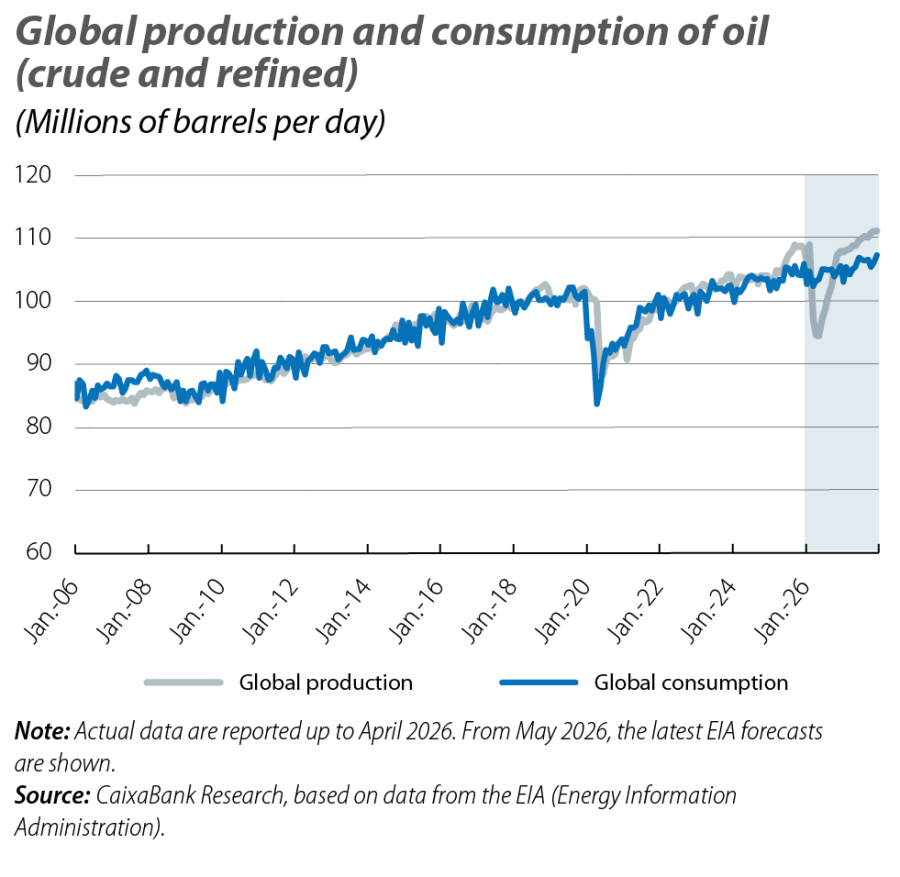
In recent months, crude oil flows from the Gulf have dropped from 20 million barrels per day (mb/d) to 8 mb/d, due to the collapse of flows through the Strait of Hormuz (from 16 mb/d to less than 2 mb/d). This has been only partially offset by redirecting flows to alternative routes, notably the port of Yanbu in the Red Sea (see second chart). In this context, global oil production has fallen from around 106-108 mb/d to approximately 95 mb/d in April, indicating that the drop in production in Gulf countries has only been modestly offset by higher production in other regions. At the same time, global consumption has remained relatively stable, at around 103 mb/d in March and April (compared to approximately 104 mb/d in 2025). This indicates that the decline in demand remains limited and is mainly concentrated in a few Asian countries and in certain refined products.2 Thus, the global oil market has shifted from an oil supply surplus (crude and refined products) of nearly 2.0 mb/d3 to a deficit exceeding 8 mb/d. The key to mitigating this deficit has been the use of inventories.
- 2
For further details, see the May 2026 «Oil Market Report» by the International Energy Agency (IEA).
- 3
See the Focus «The oil market enters unknown territory», in the MR04/2026.
Global oil inventories: the secret of the unicorn
Oil inventories can be divided into four layers. The first is oil that is stored on ships, either stationary or in transit, known as «oil on water». Due to its rapid availability, it is considered the first layer that typically provides flexibility to the market. Secondly, there are commercial inventories. These refer to the stocks of crude oil and derivatives held by the private sector – such as oil companies, refineries, and logistics operators – which are used for the ordinary functioning of the market. The level of these inventories is a key indicator of balance in the market, as it responds to the economic incentives generated by the conditions of supply and demand. Therefore, monitoring them is essential for assessing tensions in the sector and anticipating movements in oil prices. Thirdly, there are the strategic petroleum reserves (SPRs), primarily of crude oil, managed by governments with the aim of enhancing energy security and responding to exceptional situations, such as severe supply disruptions, geopolitical conflicts or natural disasters. Unlike commercial inventories, these reserves are not used for regular operational purposes; rather, they are released deliberately to stabilise the market and mitigate the impact of supply shocks.4 Therefore, they are a key tool in energy policy, capable of temporarily influencing global oil supply and prices. Finally, there are «operational minimums», which are necessary to keep the market physically functioning. As the final «cushion» in the oil market, between the three previous layers and the bottom levels defined by operating constraints, there are demand destruction scenarios. Here, the pricing system becomes the main balancing mechanism, cooling consumption to prevent stocks from falling to critical levels.5
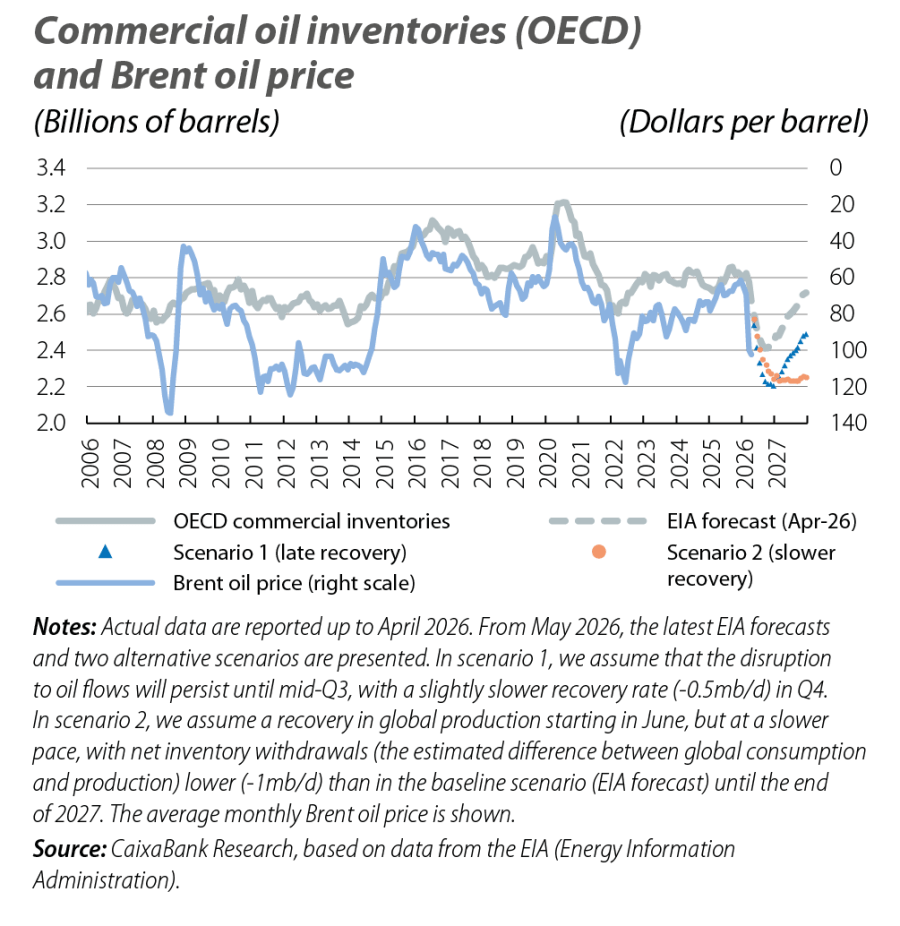
OECD countries’ commercial oil inventories remain within their historical range. At the end of April, they stood just below 2.7 billion barrels, compared to an average of around 2.9 billion over the past decade. However, their rapid reduction (–150 million barrels between March and April) suggests that, at the current rate, commercial stocks could approach critically low levels by Q3. Even under the (benign) assumption of a swift resumption of global oil production beginning in June, returning to pre-conflict levels by the end of Q4 2026, OECD commercial stocks could hit historic lows in June and reach 2.4 billion barrels in Q3, slowly normalising thereafter. This reduction in commercial inventory levels implies a higher likelihood of non-linear price spikes in the coming months. Furthermore, those countries (and products) that are more dependent on energy supplies from Gulf countries, and whose reserves are more limited, will remain more vulnerable.6
For illustrative purposes, other scenarios could lead to greater market imbalances. On one hand, the short-term disruption could be greater than expected if talks between Iran and the US do not allow for a recovery of flows from June, leading to inventories reaching even lower levels in the coming months. On the other hand, the recovery of global oil production could be more gradual than expected, for instance, due to greater than anticipated damage to oil infrastructure
in the Persian Gulf or difficulties in restoring shipping flows through the Strait of Hormuz to pre-conflict levels, which would lead to lower inventory levels for a longer period. Given the close correlation between Brent prices and commercial inventories, these scenarios would entail even greater price pressures in the coming years.7
- 4
On 11 March, the IEA announced the release of 400 million barrels from its strategic reserves, estimated at around 1.2 billion barrels (with more than 600 million barrels held under government obligation). This was only the sixth joint release of reserves (following the crises of 1991, 2005, 2011, and 2022, the last with two announcements of reserve releases).
- 5
These minimum operating thresholds are related to the volumes that must be maintained in oil infrastructures – such as tanks, pipelines, or underground cavities – for technical reasons. These levels serve as a non-usable layer necessary to ensure the proper functioning of the system (pressure levels, flows, operational safety). It is estimated that minimum operating oil levels are equivalent to around 30 days of demand (i.e. with consumption like that of the OECD, at 45-47 mb/d, this would equate to approximately 1.4 billion barrels).
- 6
Although the oil market still seems far from critical operational thresholds at a macro level, inventory levels vary widely by region and product. Inventories of refined products (such as aviation fuel and naphtha) have deteriorated more rapidly than those of crude oil, while several emerging Asian countries are experiencing supply difficulties.
- 7
In its latest «Oil Market Report» from May 2026, the IEA estimates a cumulative loss of 900 million barrels (including the release of 400 million barrels from strategic reserves), assuming the conflict ends in June and production recovers from Q3. The IEA estimates that this figure could double in the event of a prolonged conflict.
Brent: what will be the (new) equilibrium price?
Despite futures contracts indicating structurally higher oil prices in the coming years as a result of the biggest oil shock in history, markets also seem to be assuming a rapid normalisation of supply and demand conditions in the coming months. In this scenario, global inventories would remain the main mechanism for absorbing the current supply shock, and the Brent oil price is currently converging towards an equilibrium of around 80 dollars per barrel. Even so, it is important to recall that futures contract prices do not provide a crystal ball. Rather than reflecting predictive power, they offer the possibility of securing deliveries of a specific quantity of a scarce good in the future at a set price, based on currently available information. Similarly, just as the negative slope of the curve indicates high market tension in the short term, in the long term the market will likely continue to be characterised by a long tail of upside risks.
Geopolitics
We analyse the major geopolitical trends and thier effects on the financial markets and the economy.