The anatomy of productivity in the euro area
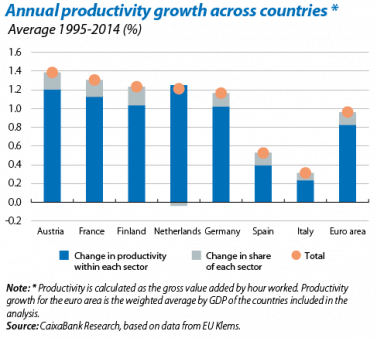
There has been a lot of debate regarding the possible reasons for the euro area’s weak growth over the past few years. The low productivity growth is among the most worrying.1 It has stayed at around 1% year-on-year for the past two decades (see the first chart), clearly below the US, whose productivity has increased by 1.6% over the same period.
The trend in productivity growth in the different euro area countries appears to be quite varied. In general, the countries of central and northern Europe, such as Germany and France, have recorded larger increases although these are not especially high. The countries in southern Europe, however, have seen remarkably low rates of productivity growth.
Another important point is that productivity growth has varied greatly between sectors. In this respect, it is revealing to break down the increase in productivity for the economy as a whole into the growth within sectors and the change in their relative weights or share of the total. As can be seen in the first chart, most of this increase comes not from higher productivity sectors increasing their share but from an increase in productivity within sectors. For instance, 88% of Germany’s productivity growth has come from an increase in sector productivity (that which would be observed if the share of all the sectors remained constant). In Spain this figure is 75%.
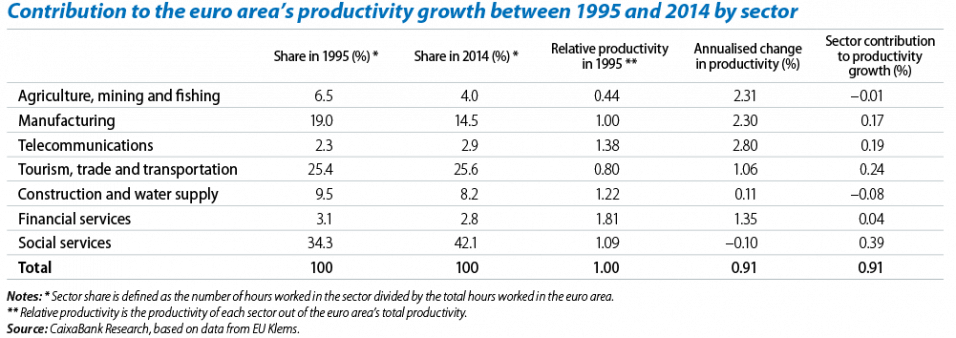
Another way to reveal the pattern is by breaking down the analysis to sector level (see the table). For the euro area as a whole, the social services sector (education, health, defence, etc.) and manufacturing exhibit a notably different pattern of productivity growth. Productivity in the social services sector is higher than for the economy as a whole but has not grown over the past few years. Its contribution to the economy’s overall growth in productivity therefore comes from the considerable increase in its relative weight over the past few years (from 34% to 42%).2 The trend in the manufacturing sector has been quite different. In this case productivity growth has been very high, 2.3% annualised between 1995 and 2014. This sector has lost share over the past two decades, however, and its contribution to productivity growth for the economy as a whole has therefore been relatively small.
Finally, the telecom industry has also made a notable contribution to productivity growth, in this case both due to its larger share and, especially, to the sector’s higher productivity. This increase might even be underestimated as, with the available statistics, it is difficult to adequately capture the productivity growth in this sector (for instance, because it is difficult to measure the big improvements made in the quality of the goods it produces).
1. In this article, the trend in apparent labour productivity is analysed as the gross value added of each sector divided by the number of hours worked in each sector.
2. Share is measured as the number of hours worked in a sector out of the total hours worked.


