What explains the rebound in Spanish imports?
Does the rebound in imports in Spain respond to greater dynamism in domestic demand? Or does it reflect an increase in the import content of the Spanish economy?

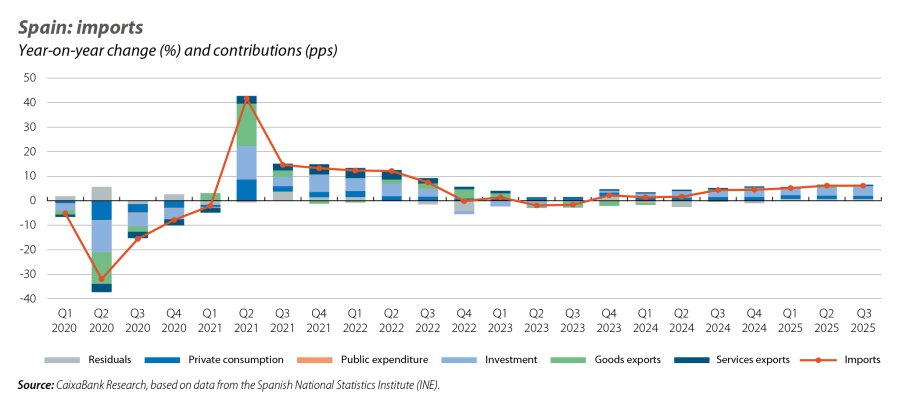
Since Q2 2024, there has been a clear rebound in Spanish imports, which have gone from recording a fall of 6% year-on-year in March 2024 to an increase of 5.3% in August 2025 (calculated using cumulative data for the trailing 12-month period). This new trend raises the need to analyse whether this rebound responds to greater dynamism of domestic demand or if it reflects an increase in the import content of our economy.

What type of goods are we importing the most?
In this section we rely on customs data on imports of goods, as they provide a more detailed breakdown by economic sector. In the second chart, we show the relative contribution of each sector to the growth of imports, in real terms and excluding energy products, comparing 2025 against the last pre-pandemic expansion cycle (2015-2019). Two facts stand out from the chart. Firstly, we can see that semi-manufactured goods and capital goods usually account for a large part of import growth, while the sectors more related to consumption – such as food, manufactured consumer goods and consumer durables – account for a smaller portion.
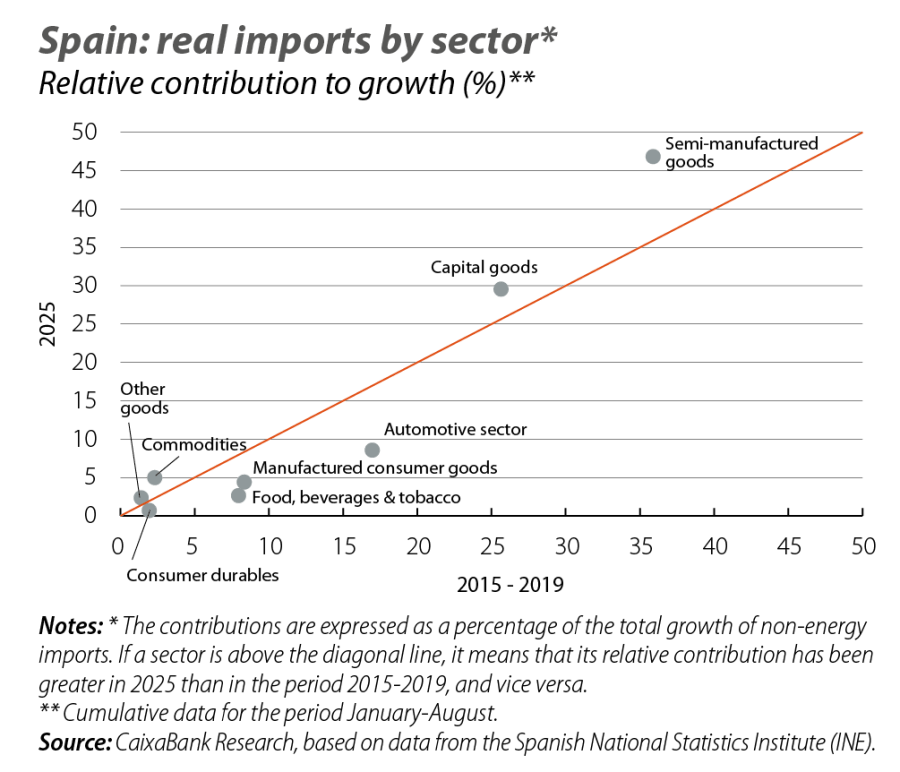
Secondly, we see that semi-manufactured goods and capital goods account for the growth of imports in 2025 to a greater extent compared to 2015-2019, while the automotive sector, food and manufactured consumer goods do so to a lesser extent. This change suggests an import profile that is currently more geared towards intermediate consumption and investment compared to the pre-pandemic period.
What has driven the recent upturn in imports?
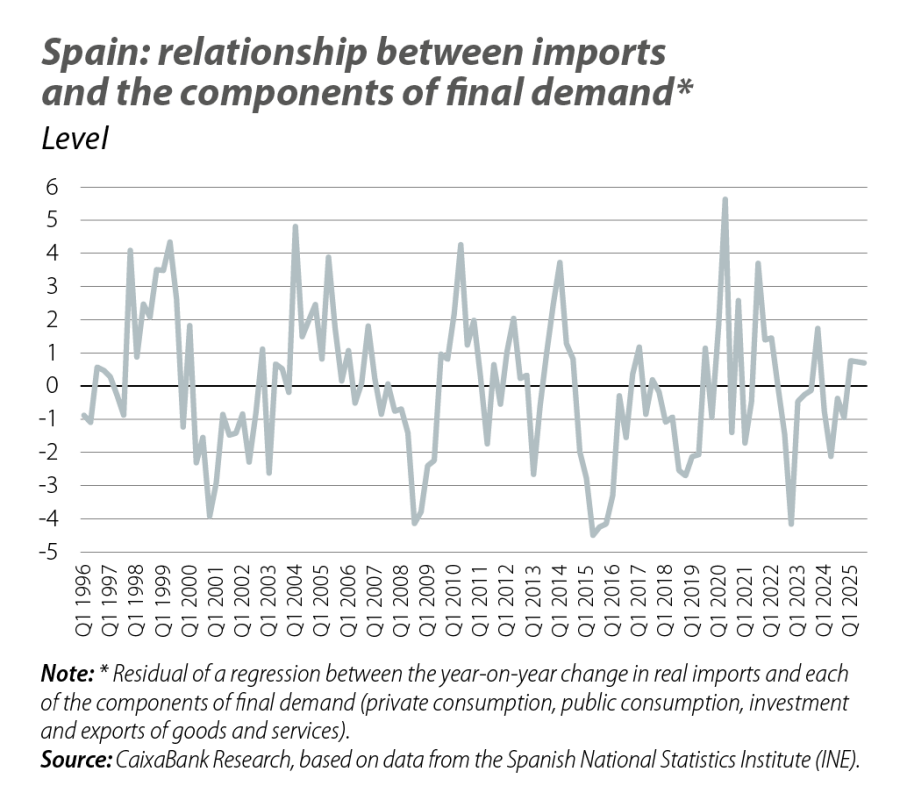
To complement the analysis, we estimated a regression of imports against the various components of final demand: private consumption, public expenditure, investment, exports of goods and exports of services. Since we worked with national accounting data, in this exercise we focused on total imports, not just those of goods. The model matches the data well and, as we would expect, shows that the components of final demand that contribute the most to explaining changes in imports are investment and exports of goods, followed by private consumption.1 The interpretation of the residuals allows us to identify deviations between actual imports and those we would expect based on final demand. In 2024, imports were slightly lower than expected (see third chart), while in 2025 the prediction errors are slightly above. In both years the magnitudes of the errors are small, suggesting that the current upturn is aligned with the behaviour of final demand and not with an increase in its import content.
- 1
We estimated a linear regression between the year-on-year change in imports, in real terms, and the year-on-year changes in the components of final demand. The regression presents an R^2 of 94%. Imports show an elasticity of 0.54 relative to investment, of 0.50 relative to exports of goods and of 0.46 relative to private consumption.
Finally, based on the estimated coefficients of the regression, we can see the evolution over time of the contributions from the various components of demand to import growth. Following the significant fluctuations triggered by the pandemic, from 2024 onwards the investment component gains prominence and goes from 1.4 pps in Q1 of that year to 4.1 pps in Q3 2025. Private consumption plays the second leading role and remains stable between 1.2 pps and 1.6 pps. This pattern reinforces the conclusion that the recent increase in Spanish imports is mainly driven by higher demand in investment, followed by that of household consumption.