Strategic dependencies and geopolitical exposure of Spain's foreign sector
The current conflict between Iran, the US and Israel marks a new supply shock that is once again straining global value chains. This episode is the latest in a string of disruptions to global trade, such as the Trump administration’s tariff policy, the energy crisis triggered by Russia’s invasion of Ukraine and the COVID-19 pandemic. It also reinforces the need to diversify supply markets, avoiding major unilateral dependencies, and to work towards greater European production capacity. This message is particularly relevant in strategic areas for medium- and long-term growth, such as technology, healthcare, defence, and the dual green and digital transition.

In this context, and in line with the European Commission's objective2 to pursue a trade policy that not only fosters an open economy but also contributes to more resilient and sustainable value chains, it is key to identify existing strategic dependencies. Based on this premise, in this article we build a trade vulnerability index (TVI) for Spain, considering different sources of risk: the degree of supplier concentration, the strategic nature of inputs, the geopolitical relationship with the source countries, and their share of the total supply. In a second stage, we examine which economic sectors depend on the most vulnerable products in order to assess how a potential disruption to their supply could affect Spanish production as a whole.
- 2
European Commission. «Trade Policy Review COM(2021) 66».
Methodology
We begin by conducting a screening of products to identify those with a higher degree of external dependency, following the approach developed by the European Commission.3 To this end, we use Customs data, which allow for a high level of granularity, beginning with an initial sample comprising over 5,000 products.4
We define the following three metrics, which allow us to detect products that are more vulnerable to external factors:
Supplier concentration indicator. This metric identifies those products for which imports are highly concentrated in a small number of source countries.5 From an initial sample of 5,495 products, those with a value exceeding 0.4 are selected, a threshold indicating a high concentration of suppliers, reducing the set to 1,697 products.
Indicator of the importance of extra-EU imports relative to total demand of each product. This metric measures the share of imports from outside the EU over Spain’s total imports, by product.6 From the set of 1,697 products, only those with a value above 0.5 in this indicator are retained, i.e. products for which more than 50% of Spanish imports are sourced from extra-EU countries. This second filter reduces the number of products to 683.
Indicator of the substitutability of imports. It compares imports from extra-EU countries with the total EU exports of the same product. This indicator is a proxy for the productive capacity within the EU that could potentially be redirected towards Spain in the event of an external supply cutoff. A high indicator points to a limited capacity for substitution within the EU market.7 Specifically, products with values exceeding 0.2 are selected,8 i.e. those for which at least 20% of total European production would be required in order to meet Spanish demand. Applying this third filter, the number of products stands at 168.
- 3
European Commission (2021). «Strategic Dependencies and Capacities».
- 4
Products are used at the Harmonized System 6 (HS6) level, equivalent to the 6-digit TARIC classification.
- 5
For this purpose, we use the Herfindahl‑Hirschman Index (HHI), calculated as follows: \(ID1_k=\sum_{i=1}^{n_k}(p_{i,k}^2)\)where pi is the share of supplier country i in Spain's total imports of product k, and n is the total number of supplier countries for that particular product. A value close to 1 indicates a high concentration of supply in a few source countries, while lower values reflect greater diversification of import origins.
- 6
A high value of this indicator points to a greater dependence on non-EU suppliers and, therefore, a reduced capacity to respond to external shocks.
Formally: \(ID2_k=\frac{Extra-EU\;Imports\;of\;product\;k}{Total\;Spanish\;imports\;of\;product\;k}\\\)
- 7
Defined as: \(ID3_k=\frac{Extra-EU\;Spanish\;Imports\;of\;product\;k}{Total\;EU\;exports\;to\;the\;world\;of\;product\;k}\)
- 8
The value of 0.2 represents the 75th percentile of the distribution, i.e. only 25% of all products have a higher value of this index.
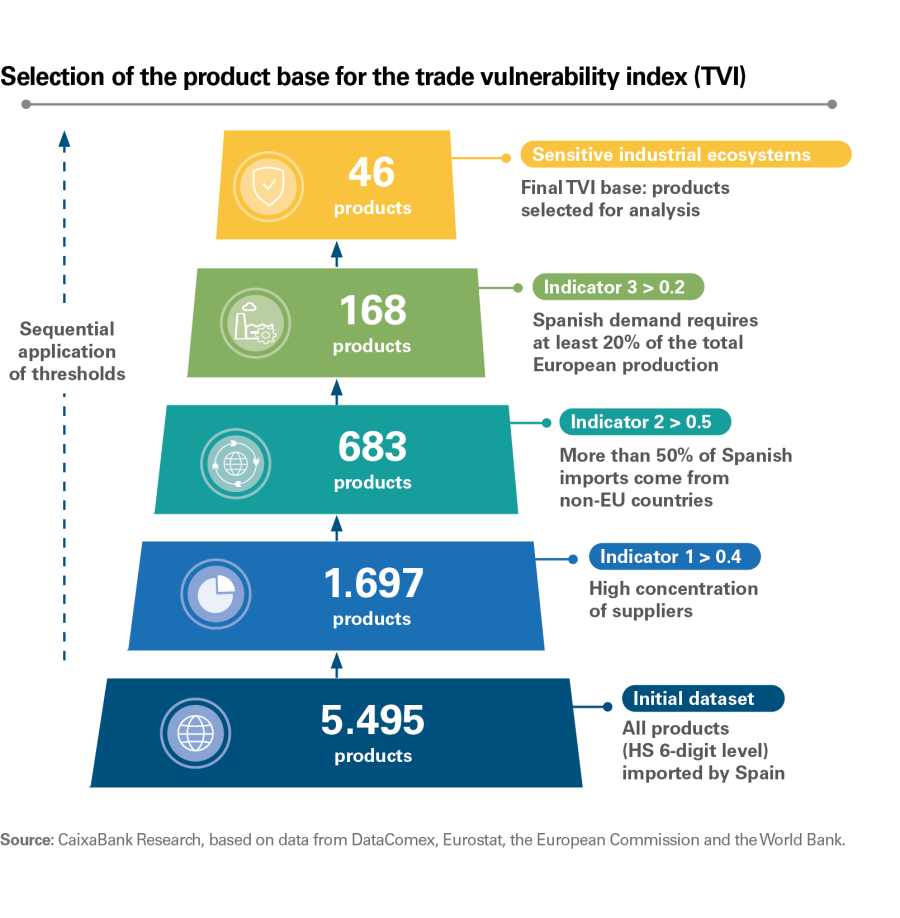
Finally, in a fourth screening, we limit ourselves to products that are part of sensitive industrial ecosystems9 (healthcare, energy-intensive industries, aerospace and defence, digital industries, electronics and renewable energies).10 As a result, the final set comprises 46 products, which form the basis of this analysis (see the chart on the previous page).
For this set of products identified in the screening phase, we then build the trade vulnerability index (TVI) at the product-country level. This incorporates three dimensions that provide a more comprehensive view of the risk associated with external supply:11
Firstly, we consider the strategic nature of the product, based on its inclusion in the lists of critical and/or strategic raw materials defined by the EU. This criterion allows us to identify inputs whose availability is particularly key from an economic, technological or security perspective.
Secondly, we incorporate the supplier country's share for the product in question, measured as the proportion of Spanish imports of the product from each source country over total Spanish imports of that product. This component captures the degree of dependency on specific suppliers and, therefore, the exposure to potential supply disruptions associated with those sources.
Finally, the index captures the geopolitical risk in the supplier country. This is measured using a composite index that combines a strategic alignment indicator – such as EU membership or the existence of trade agreements and international alliances (NATO, OECD, among others) – with an institutional quality indicator based on the World Bank’s Worldwide Governance Indicators (WGIs).12 The latter capture six aspects: voice and accountability, political stability, government effectiveness, regulatory quality, rule of law, and control of corruption.13
- 9
EC Council (16 November 2020). 13004/20 paragraph 3. Industrial Ecosystems | European Cluster Collaboration Platform.
- 10
The robustness of the result is checked by varying the selection thresholds both individually and jointly (ID1 between 0.30–0.45, ID2 between 0.40-0.60 and ID3 between 0.15-0.25). Although the number of products identified changes, the core of the main dependencies remains unchanged (the top 10 is identical in all scenarios), confirming the stability of the results.
- 11
The TVI is obtained as a weighted average of the three dimensions considered – criticality, supplier share, and geopolitical risk –, the values of which are established based on standardised classifications on a scale from 0 to 1 to ensure their comparability. Higher index values indicate greater vulnerability.
- 12
https://www.worldbank.org/en/publication/worldwide-governance-indicators/interactive-data-access
- 13
The average is taken and inversely re-scaled to reflect higher levels of risk.
Key products and most exposed sectors
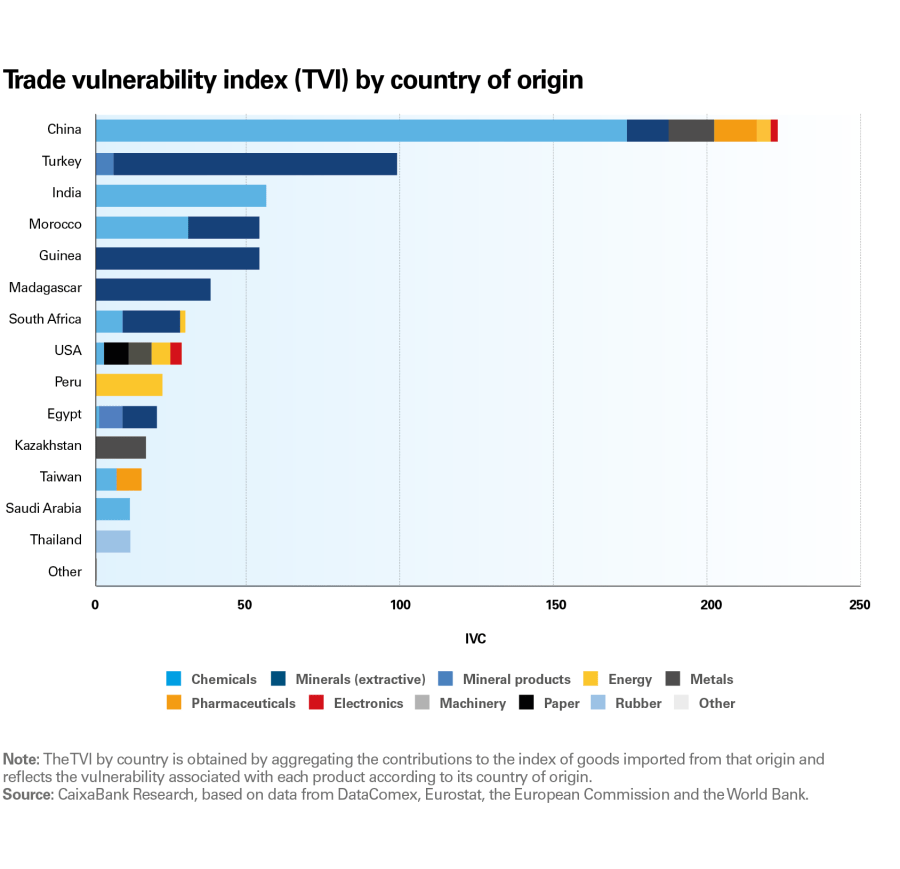
The trade vulnerability of the Spanish economy is predominantly concentrated in basic inputs (see the previous chart), in particular mineral raw materials and intermediate chemical products. Some of these are considered strategic or critical for the EU,14 primarily those associated with extractive activities and the chemicals industry, with indirect effects on multiple productive sectors.
In a second tier of vulnerability we find energy inputs and metallurgy related inputs, which also have a widespread impact on the entire productive base. Somewhat further behind, we find some intermediate transformation products, such as rubber, certain pharmaceutical and metallic products, as well as non-metallic minerals. Marginally, we find paper products, telecommunications equipment, and equipment related to the aerospace and defence sectors.
Specifically, among the products with the greatest vulnerability, aluminium minerals stand out as having the highest TVI of all. This is because the EU considers them strategic raw materials and because 80% of imports come from Guinea, creating an extreme unilateral dependency. These minerals are an essential input for the production of primary aluminium, which is used in the metallurgical industry, construction, transport, aeronautics and numerous components related to the energy transition.
- 14
Critical Raw Materials Act, Regulation (EU) 2024/1252. It defines raw materials as critical due to their high economic importance and high supply risk stemming from a supply that is concentrated in just a few countries, increasing demand associated with the ecological and digital transitions, and uses in defence and aerospace, as well as a context of growing geopolitical tensions and competition for resources. Strategic raw materials are essential inputs for key technologies in the green and digital transition, as well as for defence and aerospace industries, the importance of which depends on their use in technologies, the volumes required, and the anticipated global demand.
Natural borates, which are ranked second in the TVI and are also classified as strategic, show an almost total dependence on Turkey. They are used in the manufacture of glass, advanced ceramics, fertilisers and in various industrial chemical processes, playing a role in multiple production chains.
Next in terms of vulnerability is natural graphite, included in the list of critical raw materials, with a high supply concentration (80%) from Madagascar. This is a key input for the manufacture of batteries and energy storage systems, with direct applications in metallurgy, the chemicals industry and activities related to electric mobility technologies.
Manganese minerals also stand out, with high criticality and dependence mainly on South Africa (70%) and Gabon (30%). Their use is concentrated in the manufacture of steel and alloys and, increasingly, in battery components, making it a strategic upstream industrial input.
In the chemicals sector, there is a particularly high dependency on phosphoric acid from Morocco, accounting for 80% of all imports of this product. This is an essential input for fertiliser production, with a direct impact on agriculture and the agrifood industry, thus extending the vulnerability beyond the chemicals sector itself.
Finally, 80% of anthracite imports come from Peru. This is used as an energy input and as a reducing agent in metallurgical processes, facilitating the extraction of metals from ores, as well as being used in other energy-intensive industries, which explains its high vulnerability profile despite being a conventional energy product.
Risk geography
From a geographical perspective, the TVI is concentrated in a handful of countries (see the previous chart), with China standing out as by far the leading source country, with a diversified supply of products that includes chemical, metallic, pharmaceutical, mineral, and energy inputs.
Next, Turkey is positioned as a supplier of mineral raw materials, followed by India, concentrated in intermediate chemical products. Morocco has a strong presence in fertilisers and, along with Guinea and Madagascar, stands out as an important supplier of mineral raw materials. With a lower level of risk, South Africa stands out as the main supplier of manganese (a material considered essential by the EU); the USA, with diversified contributions in electronic equipment and metallic inputs; and Peru and Egypt, specialising in energy and mineral inputs. This group is completed by Kazakhstan, specialising in ferroalloys, and Taiwan, with a presence in chemical and pharmaceutical inputs, while the remaining countries make a marginal contribution to the overall TVI.
Among the products sourced from China with the highest TVI we find barium carbonate, derived from the processing of barite (a critical raw material according to the EU), of which China supplies 40% of Spain’s imports. This material is used in glass for screens and electronic components, fibreglass, insulating materials, and industrial processes that require chemical and thermal resistance.
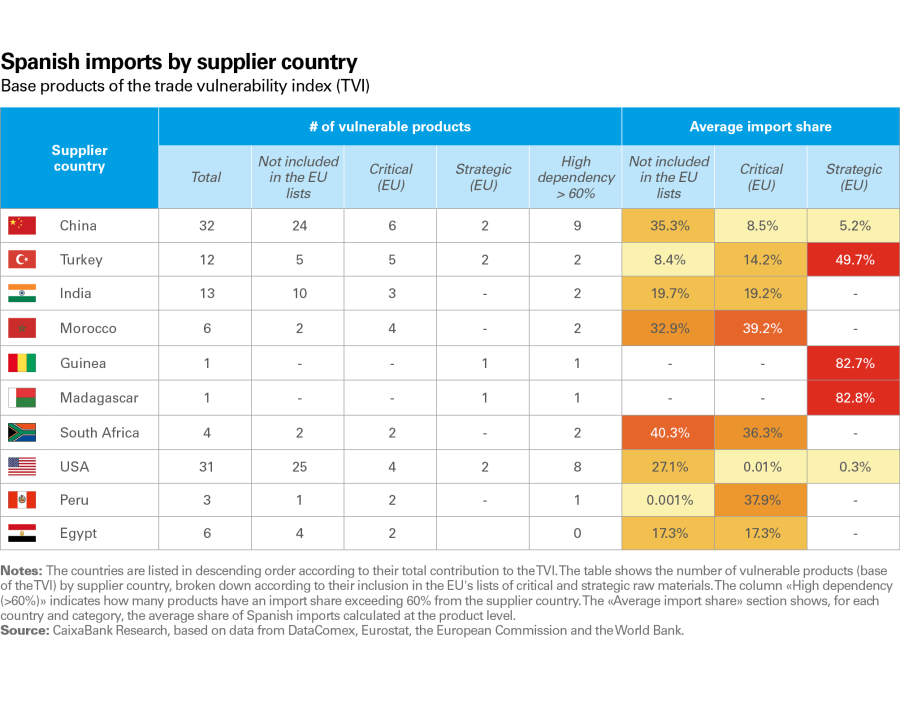
The vast majority of products associated with China are not classified by the EU as critical materials
The vast majority of products associated with China are not classified by the EU as critical materials (see the table above), but they do exhibit extreme supply concentrations and are key inputs for strategic industrial sectors. In particular, China supplies 100% of organic phosphonates, used to prevent equipment corrosion and ensure the operation of energy-intensive industrial facilities; over 90% of products such as chloropicrin and piperonal, used in the synthesis of agrochemicals and pharmaceutical active ingredients; and more than 80% of fluorinated gases (HFCs), used in refrigeration systems, air conditioning, and industrial climate control equipment. It also holds a share of more than 90% of the irradiated nuclear fuel linked to electricity generation.
Turkey, for its part, supplies almost all natural borates and around 70% of feldspar, a basic input in industrial processes requiring high temperatures that is present in the manufacture of non-metallic mineral products such as glass, ceramics and tiles, thus indirectly affecting the construction and manufacturing industry sectors. Morocco accounts for nearly 80% of phosphoric acid imports, as well as significant shares in phosphates, which are essential inputs for fertiliser production. India stands out as the dominant supplier of naphthylamines (over 90%), which are key intermediate products for dyes and specialty chemicals. It is also the source of a significant portion of barium carbonate, a raw material used in glass and ceramics, both having a major impact on the chemicals industry.
Macroeconomic impact
Estimating macroeconomic effects from the identified vulnerabilities is beyond the scope of this exercise. However, recent work by the European Central Bank (Panon et al., 2024) provides a clear reference on the potential magnitude of these effects. In particular, for Spain, the simulation exercise conducted by the ECB suggests that a 50% reduction in imports of critical inputs from China and other countries aligned with China could, in the short term and assuming no substitutability, result in a 2.9% drop in the value added of Spain’s manufacturing sector. The most affected sectors would be electrical equipment manufacturing, the chemicals industry and the machinery industry, which would record the biggest declines in value added compared to the manufacturing average, reflecting their high dependence on imported critical inputs. Taken together, these results underscore the importance of ex ante policies aimed at reducing supplier concentration and increasing the substitutability of critical inputs15, as a key element to mitigate the economic costs arising from potential disruptions to value chains.
- 15
See Berthou et al., 2024. They suggest public measures such as promoting common standards for key inputs and support for compatible components among different manufacturers, accompanied by economic incentives – for example, investment aid or preferential access to public funds – conditional on firms reducing their dependence on a single supplier.