The coronavirus spreads to the markets and monetary policy takes urgent action
The COVID-19 health emergency, initially concentrated in China, has transformed into a global crisis that is crippling the world’s economy. Economic activity indicators that capture this shift in the scenario are still scarce, but its effects have been very palpable in the performance of the financial markets. Investors have suffered a sudden and severe spike in risk aversion and volatility (see first chart), which has led to historic crashes in stock and commodity prices, a surge in risk premiums (especially for corporates and emerging economies, which have also experienced capital outflow) and a general tightening of financial conditions. In response to this, the major central banks have acted quickly and decisively, guaranteeing the abundance of liquidity and easier access to credit, and anchoring an environment of low interest rates.
The markets trade a global recession
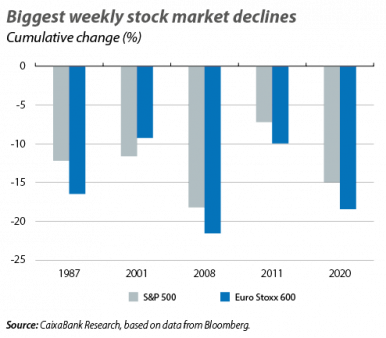
The historic collapse in the stock markets is the most striking exposure of the change in the economic scenario. Since mid-February, the world’s major stock markets have suffered their biggest setbacks in years, and at the end of March the benchmark indices had amassed losses of around 30% both in the US and in Europe. Moreover, the weakness has been similar across all sectors (registering setbacks of 20%-30%), with the exception of energy (also affected by the collapse in oil prices, the sector’s stocks lost around 50% in the US) and the health sector (with losses of somewhat less than 20%). In addition, the speed of the correction has been particularly abrupt. Whilst the losses amassed during the 2008-2009 recession approached 60%, it took a year and a half for them to reach this point. Now, in contrast, less than two months after the correction began we have already seen sessions with the greatest volatility in recent decades, both on the negative and on the positive side: in the US, such significant daily losses have not been seen since 1987, and in the closing weeks of March, the announcements of economic measures to cushion the impact of the COVID-19 epidemic resulted in daily rebounds of around 10%.
The Chinese stock market, however, has been relatively isolated from the recent turbulence: its cumulative losses so far this year have not reached 10% (in all other major stock markets, they exceed 20%), while the decline in the past month is barely 3%. This better performance seems to reflect a combination of factors. On the one hand, the country is already in the recovery phase of the COVID-19 epidemic, and decisive measures to support the economic recovery are expected. On the other hand, the stock valuation ratios came from a lower starting point (especially compared to the US). Furthermore, various market trends (such as the better performance among blue chip stocks and higher leverage) also indicate support from the authorities and greater risk taking.
The stagnation of economic activity is evident in the commodity markets, as reflected in the aggregate price indices such as that of Bloomberg or Thomson Reuters, which show falls of between 20% and 30% in the year to date. These declines are observed in the prices of industrial metals (with 20% setbacks), such as copper and aluminium. However, the collapse in prices has been particularly sharp in the case of oil: a barrel of Brent has plummeted to 20-25 dollars. This is an unusually low level in the 21st century (see third chart) and represents a fall of almost 70% compared to the price of 60 dollars registered at the beginning of the year. One of the causes of this drop is the inevitable and particularly severe impact of the containment measures on the demand for fuel. However, the freeze in demand has been exacerbated on the supply side by a price war between the OPEC countries and their partners such as Russia. This group, known as OPEC+, halted negotiations in early March to extend the crude oil production cuts (which had been in force since 2016) and the market suffered its biggest daily fall since 1991 (with the Gulf War). However, in the medium term, the prices needed to cover Russia and Saudi Arabia’s fiscal needs (around 40 or 50 dollars) and the reactivation of the global economy should support a recovery in oil prices. That said, the low levels could persist while the stagnation of the global economy continues and as long as some OPEC+ members remain interested in driving US shale producers out of the market.1
The COVID-19 epidemic is also causing interest rates to plummet, to the point that in early March yields on German and US 10-year sovereign debt registered historic lows (intraday rate: –0.89% and 0.33%, respectively). Both risk aversion and the expectation of an accommodative and decisive reaction from the central banks explain the decline in these safe-haven assets. However, throughout March, and as the need for fiscal policy to lead the fight against the COVID-19 epidemic became apparent, the expectation of greater financing needs on the part of the public sector exacerbated the declines in yields (see fourth chart).
Financial conditions tighten
The COVID-19 epidemic is not affecting all yields equally. In fact, the fear that the paralysis of economic activity could lead to cuts in credit ratings (a possible amplifier)2 or to corporate bankruptcies has driven risk premiums on corporate debt in all segments up to levels close to those of 2008-2009 (particularly in the US shale sector, also hit by the collapse in oil prices). Sovereign risk premiums of the euro area periphery were also temporarily stressed, with the combination of the expectation of greater financing needs in the public sector and a cold reception from investors to the first measures announced by the ECB (and let us not forget the words «we are not here to close spreads» muttered by its president, Christine Lagarde, which accentuated investors’ risk aversion). However, the strength of the ECB’s second round of measures (detailed below) allayed doubts over the sustainability of public debt in the euro area periphery. The surge in risk, meanwhile, was also observed in the interbank market (see sixth chart), albeit to a much more contained extent than in previous episodes.
Liquidity tensions appear, but they are localised. The most significant of them arose in the US commercial paper market (promissory notes), where, following a surge in risk premiums that denoted the absence of buyers in the market, the Fed ended up reintroducing the CPFF (commercial paper funding facility). In addition, other indications of liquidity problems appeared when, in some sessions marked by significant risk aversion, the prices of what are traditionally considered «safe-haven» assets (such as US or German sovereign debt) decreased instead of increasing: a symptom that needs to obtain liquidity were forcing some market players to sell assets which, in such a context of risk aversion, they would normally like to maintain on their balance sheet. On the other hand, and as detailed below, liquidity tensions also emerged for financing denominated in dollars abroad (see the expansion of the basis in the last chart) – something which the Fed once again stemmed in coordination with other central banks.
Financial security prices highlight the risks for emerging economies, where the COVID-19 health crisis could prove much more serious (due to their health systems having fewer resources, the existence of large, dense cities with pockets of poverty, and more fragile institutions). Furthermore, such countries are more sensitive to the tightening of international financial conditions and to the fall in commodity prices. In the year to date, emerging currencies have registered widespread depreciation against the US dollar, led by the Russian rouble, the Mexican peso, the South African rand and the Brazilian real (all with depreciation in excess of 20%). This amplifies the burden of emerging economy debt denominated in dollars, resulting in emerging economies also experiencing a surge in their risk premiums (the J.P. Morgan EMBI index has risen to levels of 2009). Moreover, in recent weeks there has been an unprecedented outflow of capital from emerging economies, as shown by the data on portfolio flows produced by the Institute of International Finance (see seventh chart).
Monetary policy to the rescue
Monetary policy is responding quickly and decisively, but requests the leadership of fiscal policy. Faced with the self-imposed disruption of economic activity which is paralysing both economies’ supply and their demand (domestic and foreign), the actions taken by monetary policy focus on three areas: (i) preventing liquidity problems, (ii) facilitating access to credit for businesses and households, and (iii) anchoring a low interest rate environment which, in addition to supporting the economic recovery when the restrictions on activity are lifted, can provide cover in order for fiscal policy to act aggressively and without raising doubts about the sustainability of the public accounts.
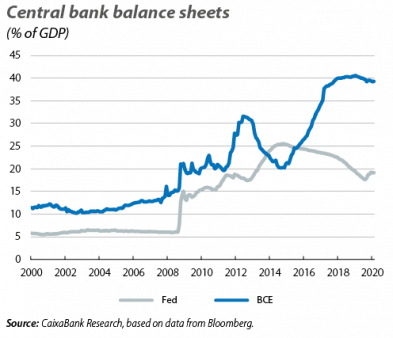
Central banks have launched a wide range of measures (see accompanying table).3 Those with the margin to do so have slashed rates to almost 0% (by –150 bps in the case of the Fed, and by –65 bps in that of the Bank of England), while the rest (such as the ECB and the Bank of Japan) have kept rates at their historic lows. In addition, all of them have implemented significant measures to ensure an abundance of liquidity and favourable credit conditions. For instance, the Fed launched liquidity lines amounting to 1 trillion dollars a week, while the ECB cut the cost of the TLTROs, increased their volume and eased various regulatory requirements on the financial sector. Also, both central banks expanded the range of assets accepted as collateral for their liquidity injections. On the other hand, the most aggressive step came in the form of the asset purchase programmes, which not only inject liquidity but also enable the anchoring of low interest rates and placate risk aversion. In particular, the Fed announced unlimited purchases of sovereign bonds and mortgage-backed securities (MBSs), as well as purchases of corporate debt (in primary markets with the PMCCF and in secondary markets with the SMCCF) and purchases of assets backed by loans received by consumers (with the TALF). The ECB, meanwhile, increased the scale of its asset purchases planned for 2020 by 870 billion euros. Of this amount, 750 billion will be implemented under the new Pandemic Emergency Purchase Programme (PEPP), practically without restrictions (in particular, without the 33% limit on assets from the same issuer or issue, and allowing temporary deviations from the capital key). In addition, the PEPP will also involve purchases of public debt with very short maturities (a notable feature given that most governments are expected to finance their fiscal packages to combat the coronavirus with short-term debt). Indeed, the size (more than 7% of euro area GDP) and flexibility of these purchases have led many analysts to conclude that the ECB has acted just as forcefully, or even more so, as if it had activated the OMT programme (which was announced by Draghi in 2012 in the midst of fears of a rupture of the euro area, but was never finally activated). Finally, in coordination with the Fed, the other major central banks have injected liquidity denominated in dollars into their respective jurisdictions. In this way, they have corrected the emergence of stress in financing denominated in dollars, which was becoming relatively more scarce (as reflected in the expansion of the basis in the last chart) due to the significant risk aversion and the US currency’s value as a safe-haven asset.
1. For more details, see the note «El Brent se desploma tras el desacuerdo entre la OPEP y sus aliados» available at www.caixabankresearch.com.
2. See the Focus «The US credit cycle: how much should it concern us? Part II» in the MR06/2019.
3. More details in the ECB Observatory of 19 March, «El BCE actúa de emergencia contra el COVID-19», and the Fed Observatory of 16 March, «La Fed bombea liquidez y lleva los tipos al 0%».


