
The Belt and Road Initiative: a double-edged sword? (part II)
With the Belt and Road Initiative, China has not only diversified the destinations of its exports in recent years, but has also diversified the origins of its imports, becoming a voracious consumer of commodities.
In recent decades, China has managed to transform its export and import profile through the Belt and Road Initiative (BRI), which has sought to facilitate trade with foreign markets. One of the most important dimensions of this trade is the improvement of access to key inputs for the development of its industry. Moreover, as has happened with the destinations of the country’s exports, the origins of its imports have also diversified in recent years, albeit not at the product level, where there has been an increase in the concentration of imports.1
- 1
The Herfindahl-Hirschman (HH) index for the geographical concentration of China’s imports has decreased from 460.5 in 2011-2013 to 384.4 in 2021-2023, while the index for concentration by product (at the HS4 level) has increased from 342.6 to 401.0 points.
China’s importer profile: a voracious consumer of commodities
Similar to what has happened on the export side,2 countries participating in the BRI account for over half of the increase in China’s imports (see first chart) in the last decade. Among the top 10 source countries that have contributed the most to the increase in Chinese imports, there are four countries that form part of the initiative (18 in the top 30), as well as Russia – a close ally, but which does not officially participate in the BRI. The top 10 account for 62% of the total increase in China’s imports over the period in question (vs. 46% in the case of exports). Among these top 10 countries, the three largest commodity exporters (Russia, Australia and Brazil) explain 25% of the total. In addition, many countries have seen substantial increases in their commodity exports to China, such as metal ores (Indonesia), crude oil (Malaysia) and gold (Switzerland), and a decline in the share of electronics and machinery exports, with the exception of South Korea and Taiwan, both of which have seen significant increases in integrated circuits.3
- 2
See the Focus «The Belt and Road Initiative: a double-edged sword? (part I)», in the MR11/2025.
- 3
Of particular note is the concentration that has taken place in exports from South Korea and Taiwan to China. In 2013, the HH product concentration index (at the HS2 level) for these countries stood at around 1,500 points (1,509.5 for South Korea, 1,646.9 for Taiwan). In 2023, the same index reached 3,144.1 points and 4,177.6 points, respectively. For comparative purposes, the product concentration index of the total exports of these countries stood at 1,519.5 points and 3,500.2 points in 2023 (1,163.7 and 1,985.9 in 2013).

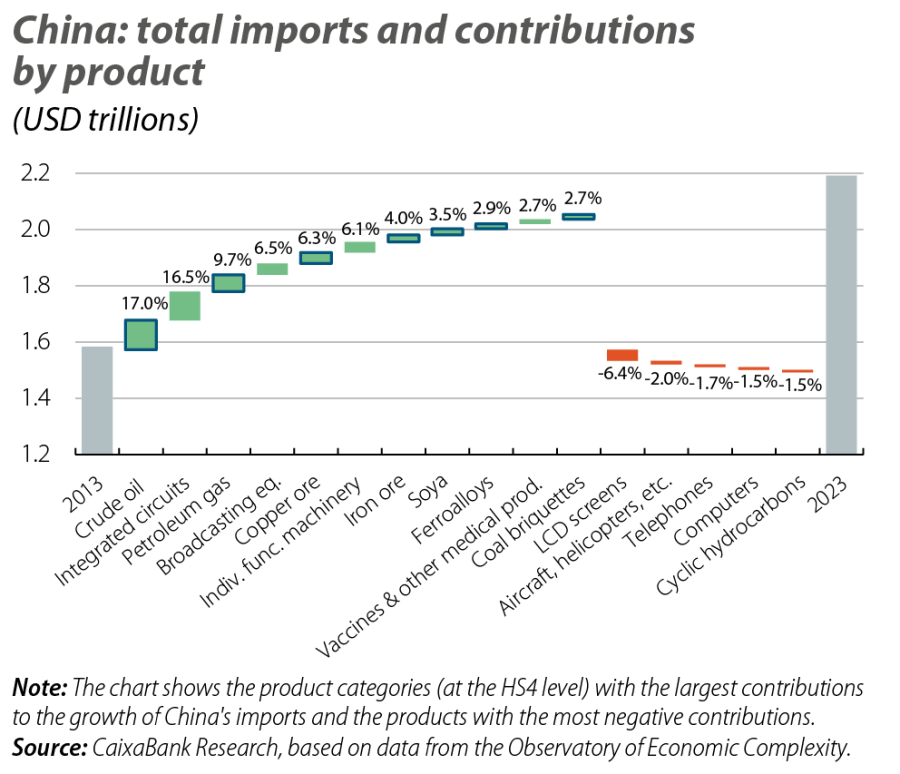
A more detailed analysis of the import profile at the product level (HS4 level of disaggregation) provides greater clarity on China’s commodity voracity over the past decade. Among the products that have contributed the most to the increase in China’s imports in the period, we find various commodities, including energy products and metals, such as crude oil (which explains 17% of the increase), natural gas (9.7%), copper and iron ore (6.3% and 4.0%, respectively) and ferroalloys.4 On the other hand, there have been significant reductions in imports of electronic products, such as LCD screens, phones and computers, while integrated circuits account for 16.5% of the total increase in Chinese imports (vs. 9.6% of the increase in exports).5
- 4
Although their aggregate contribution is lower, several commodities, such as other minerals, coal lignite, nickel and rare earths, show very high growth rates in the period. The agrifood (soya, frozen beef and corn) and chemicals (medicines, carbonates or inorganic acids) sectors have also registered substantial growth rates.
- 5
Chinese imports of integrated circuits (200 billion dollars in 2023, around 10% of total imports) have been concentrated in Asia in recent years (accounting for more than 90% of the total). South Korea (33% of the total) and Taiwan (24%) are the two largest exporters to China, while Vietnam (8%) has grown rapidly, and Malaysia (9%) and Japan (7%) have lost relative importance.
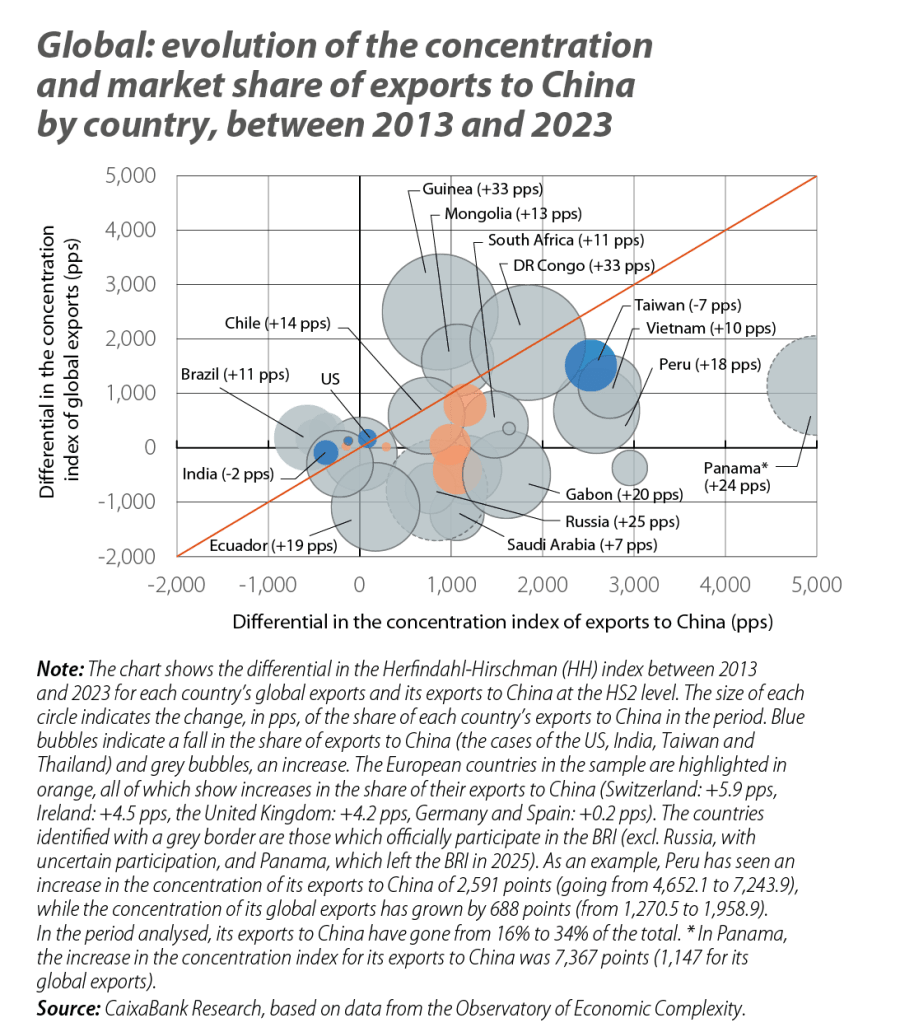
The profound changes in China’s import profile, and in particular its growing intensity in critical commodities,6 are visible in the export profiles of its largest trading partners, especially in the differential observed between the product distribution of their global exports compared to their exports to the Asian giant, and in the concentration that has occurred in the latter (see third chart). Although the differences observed are marginal in the cases of some energy-producing countries (e.g. Iraq, Oman and Saudi Arabia), in most cases the differential in the export concentration is high. Among these, we can distinguish three groups. On the one hand, we find countries that have seen a sharp acceleration in the concentration of their exports to China over the past decade, including producers of minerals such as copper (Panama, Peru and Chile), cobalt (DR Congo) and manganese and chromium (South Africa), as well as chemical elements (Djibouti) and electronics (Taiwan and Vietnam). On the other hand, some large global commodity producers have not seen any significant growth in the concentration of their exports to China (such as the UAE, Australia and Brazil), although the product concentration of their exports to China is greater than the global average. In the group of countries with higher incomes, and with the most diversified export profiles, China also maintains a more concentrated import profile than other countries.7
- 6
In the case of rare earths, China’s reserves are estimated to be between 44 and 50 million metric tonnes, about half of global reserves. On the other hand, China accounted for virtually 70% of global extraction (or 270,000 metric tonnes) in 2024. In addition to leading the world in rare earth reserves and extraction, China is a net importer of these materials, on a gross basis, which reflects the competitiveness of its refining industries and the high demand for these materials from its manufacturing industry as essential inputs for a wide range of sectors, such as machinery, electronics and motor vehicles. Also, in 2024, China imported 130,000 metric tonnes of rare earth. The top 5 biggest exporters, in value terms, include three Asian countries that participate in the BRI (Myanmar, Malaysia and Laos), Russia and India. See «Rare Earth Elements: Understanding China’s Dominance in Global Supply Chains», China Briefing, published on 29 August 2025 (last access: 19/11/2025).
- 7
For example, from Switzerland and the United Kingdom, of particular note is the increase in imports of gold, while from Ireland it is those of electrical and electronic machinery. In the case of Malaysia, the decline in the concentration of exports to China is explained by the reduced importance of electrical and electronic machinery, while fuel exports account for almost 40% of the total (vs. 23% in global terms), versus around 10% a decade ago.
The Silk Road of the 21st century: commodities and chips, via manufactured products
China has succeeded in reinforcing its status as the «world’s factory» in the last decade and has diversified the geographical distribution of its exports while gaining importance as a destination market for its trading partners’ exports. Its growth model, anchored in high investment and oriented towards international markets, has transformed over time, with significant growth in strategic sectors such as green energy, electric mobility and advanced electronics. There has also been a reconfiguration of global trade relations, with China gaining a competitive advantage across a broad spectrum of the manufacturing sector while becoming an avid importer of intermediate goods, including energy, minerals and integrated circuits. China’s main trading partners, especially those participating in the Belt and Road Initiative, have thus become direct witnesses to the Asian giant’s profound transformation. In this way, while China has gained importance in global trade, it has also triggered changes in the productive structure of these countries. Furthermore, while creating opportunities by promoting investment and increasing trade flows between countries, greater economic integration with China can also pose certain risks by promoting low-value-added extractive industries and by generating greater dependence on the Asian giant in economic, financial and geopolitical terms.
Geopolitics
We analyse the major geopolitical trends and thier effects on the financial markets and the economy.